Dashboard
Finding things
Jump to any unit, deployment, domain or variable with Ctrl-K, search a project from the CLI, and filter logs with @level:error. The full reference for the search language.
On this page
Everything in a project can be found by typing a few letters. The dashboard has one search for names and one for logs, and the CLI has both. They share a single filter language, described in full at the end of this page.
Find, the palette#
Press Ctrl + K (⌘ + K on a Mac) anywhere in the dashboard. F and / do the same when your cursor is not in a text box, and the Search button in the top bar does too. (Inside a log panel, / goes to that log's filter instead.)
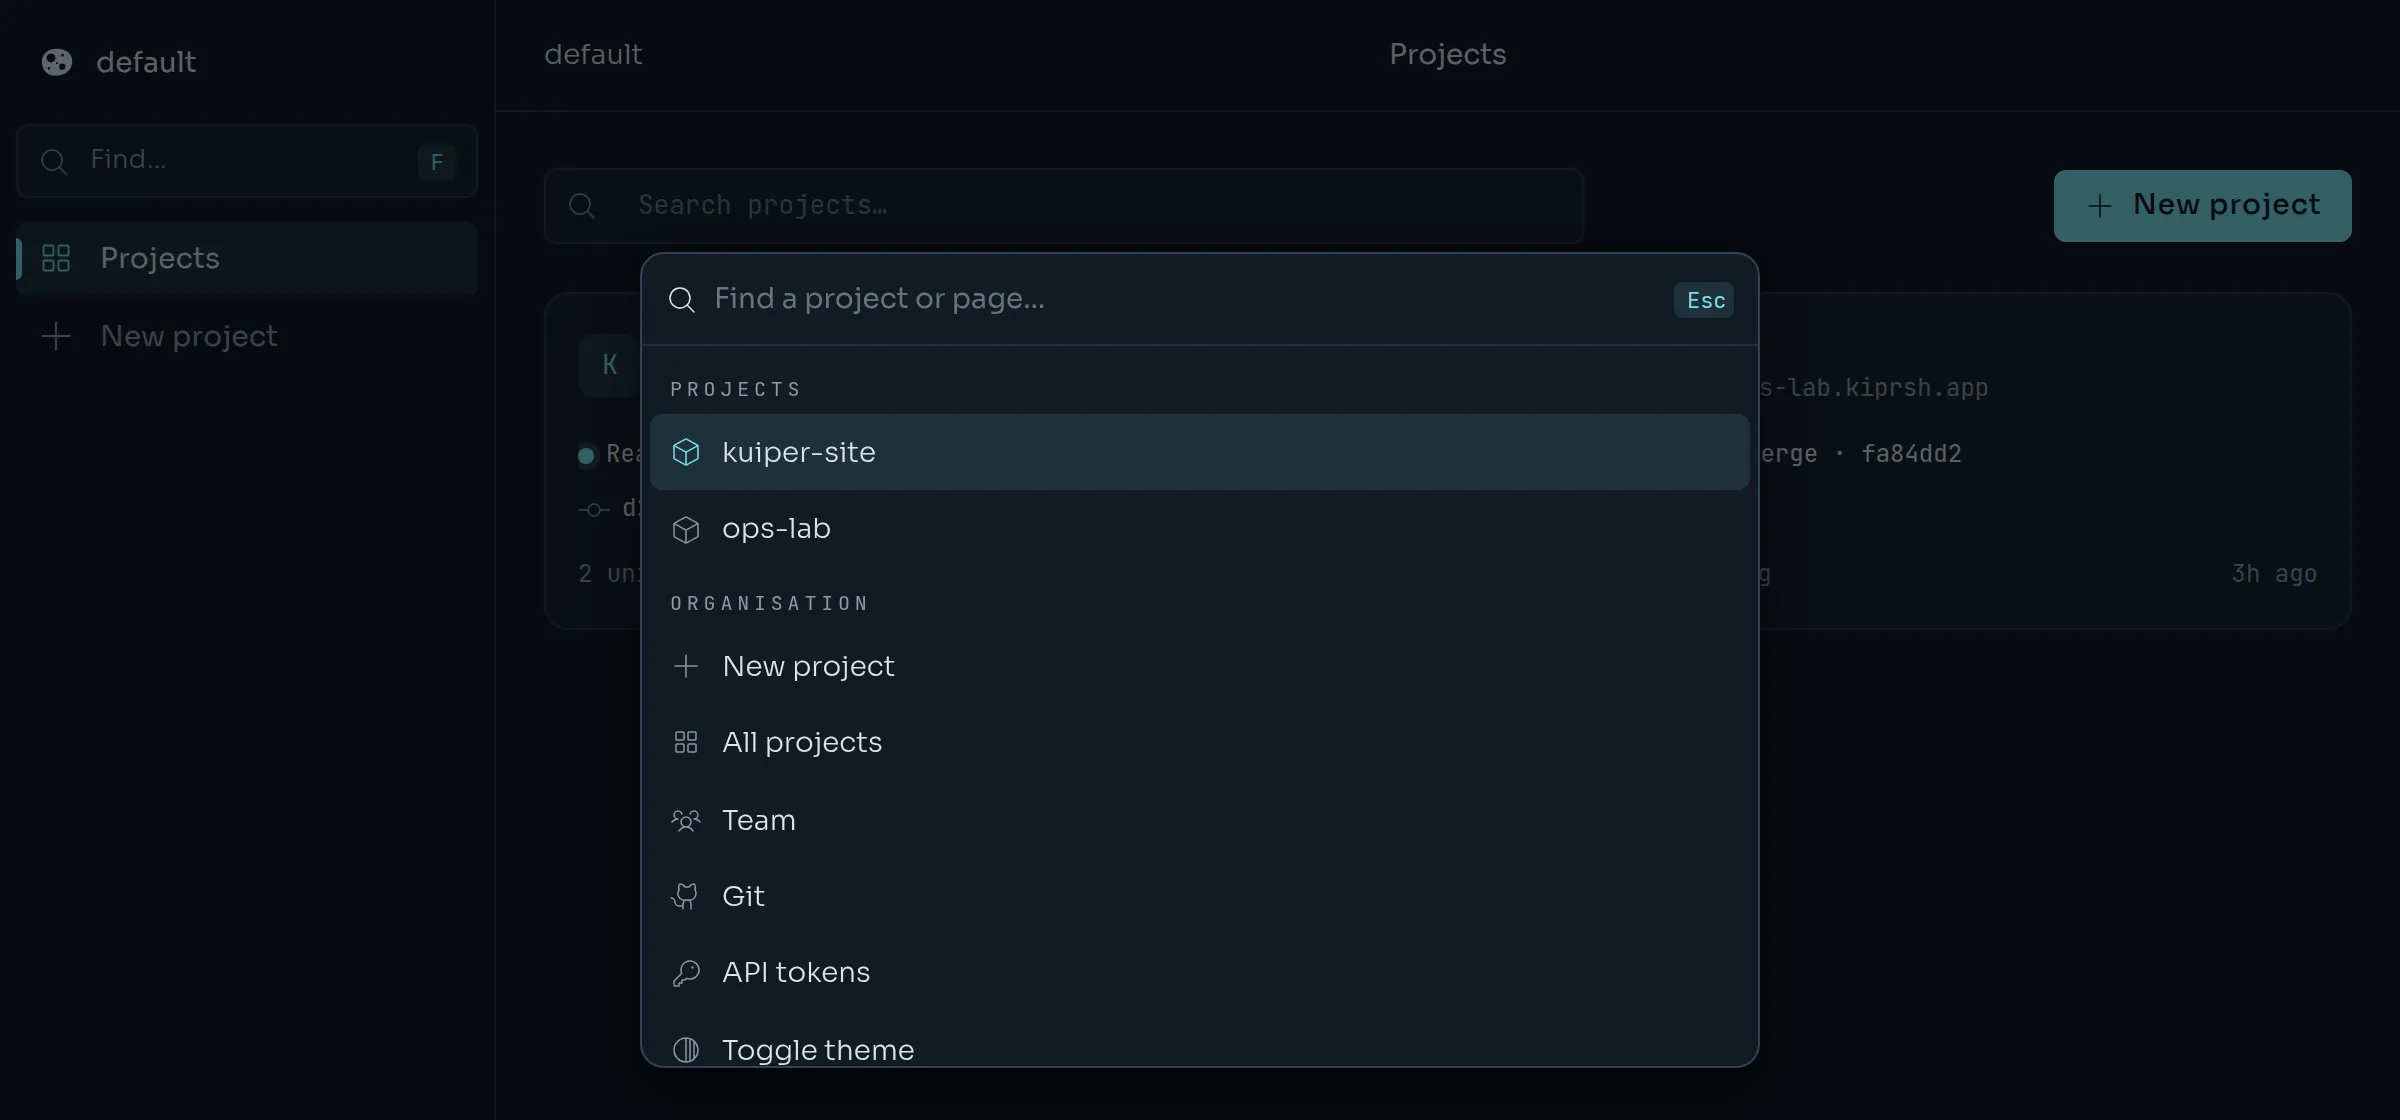
Type a few letters. Kuiper answers from what the page already knows (projects, the open project's units, pages and actions) and, a moment later, from a search of the project:
| Group | What matches |
|---|---|
| Units | The unit's name, its address (web-lab.kiprsh.app) or its kind (station). |
| Deployments | The start of its ID (with or without dep_), the start of its commit SHA, its number (#12), its branch, its status, and the commit message and author of pushed commits. Newest first. |
| Domains | Your custom domains and the host they redirect to. |
| Variables | Variable names of every unit, and the names of shared values. |
| Secrets | Project secret names. |
| Databases and Buckets | Their name or engine. |
| Activity | The text of recent project events. |
Variable and secret values are never searched and never shown, only their names. Matching ignores case, and % and _ mean themselves.
With no project open, the palette searches the whole organisation: projects (by name or slug), units and domains.
| Key | What it does |
|---|---|
| ↑ ↓ | Move through the results. |
| Tab and Shift + Tab | Jump to the next or previous group. |
| Enter | Open the result, or run the action. |
| Esc | Close. Inside a confirmation, go back one step. |
Opened results are remembered and listed under Recent the next time you open the palette with nothing typed.
Actions#
Commands appear in the same list. On a unit's page the palette lists that unit's actions first. Anywhere else, type the action: restart web, copy url web, logs web.
| Action | What it does |
|---|---|
Deploy unit | Builds the unit from its linked repository and deploys it. |
Redeploy unit | Deploys the live image again with the current environment. |
Restart unit | Applies pending variable changes. |
Open logs of unit | Opens Logs on that unit. |
Open settings of unit | Opens the unit's page, with its build and run settings. |
Copy URL of unit | Copies https:// and the unit's address. |
Switch to organisation | Changes organisation, for people who belong to more than one. |
| Toggle theme | Cycles system, light and dark. |
| Sign out | Ends your session. |
Deploy, Redeploy and Restart change something, so they ask first and need the admin or owner role. Press Enter to confirm or Esc to go back.
Search from the CLI#
kuiper search web
kuiper search 3f2a1b -p lab
kuiper search "fix timeout"
kuiper search web --org
Without -p and a default project, kuiper search searches the whole organisation. --org does that even when a project is set, and --limit N changes how many results each group shows (up to 50). --json prints the raw answer, which has a dashboard route and an API path for every result.
The same search is an API call: GET /v1/projects/{project}/search?q=…&limit=…, and GET /v1/search?q=… for the organisation.
Filter logs#
Every log panel has a filter box: Logs (any unit), a deployment's Logs tab and its Runtime logs card, and the Build logs of a build. Press / while a log is focused, or on the Logs page, to jump to it.
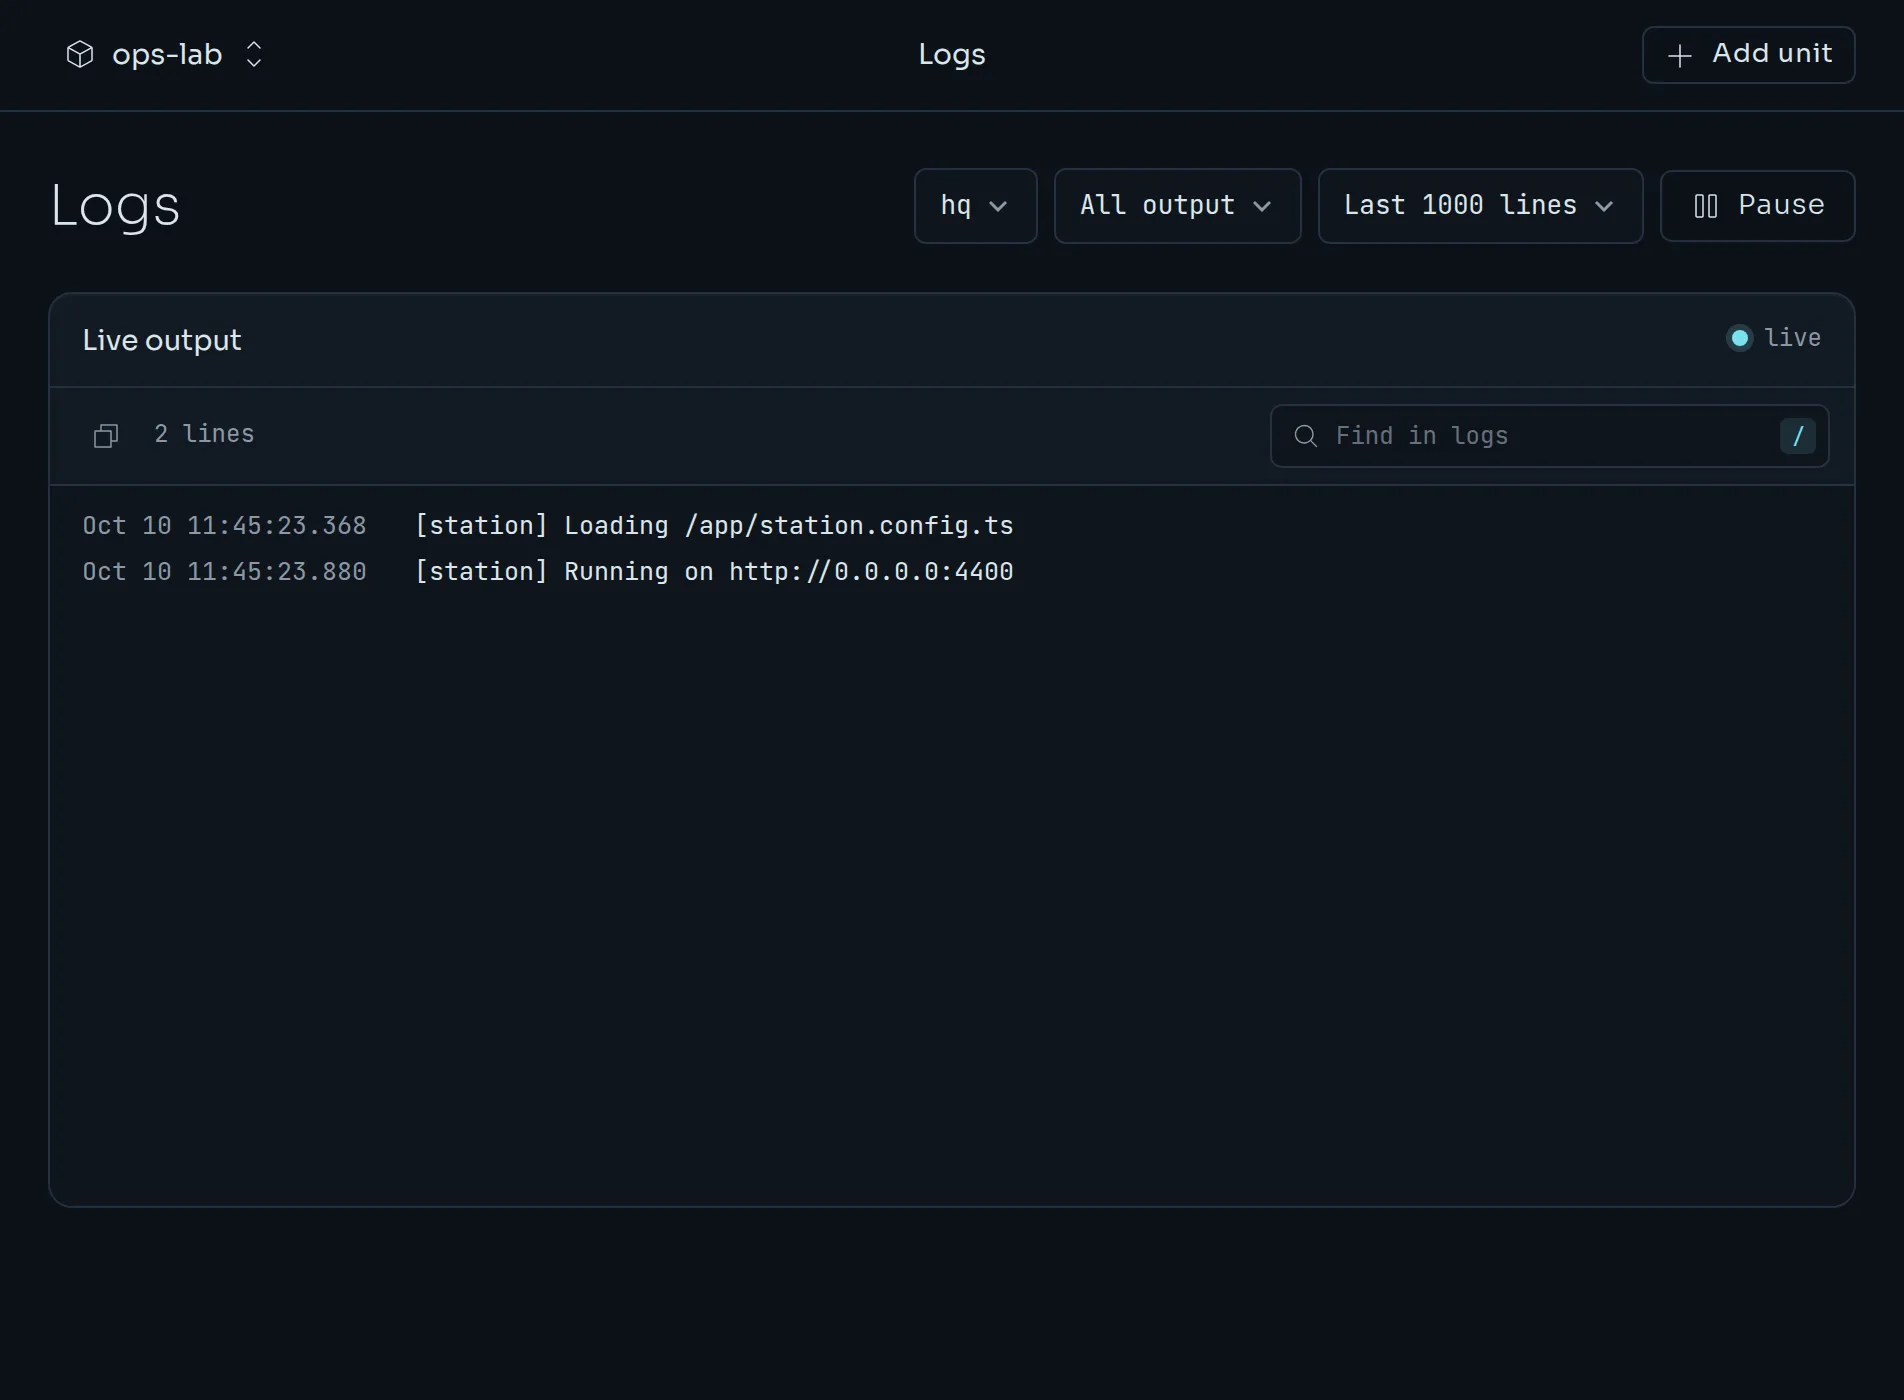
The filter runs on Kuiper, over the newest 20,000 lines the node kept, not just the lines on screen. It keeps working while the log follows live.
- JSON lines are shown as the time, a level badge, the message and the rest of the keys as
key=valuechips. Click a line to see the JSON. Click a chip to add it to the filter, or shift-click to leave lines with it out. Click a level badge to filter by level. Nested keys read ashttp.status. - Plain lines stay as they are, with ANSI colours drawn instead of printed as escape codes.
- Matches shows only the lines that match. All lines shows every line and marks the matches, so you can read around them. Enter and Shift + Enter (or the arrows) jump to the next and previous match, and the box shows how many there are.
- Wrap switches between wrapped lines and one line per row. Time hides the timestamps.
- The download button saves the log as a text file. With a filter on, it saves the lines that match.
kuiper logs -u web -q '@level:error'
kuiper logs -u web -q '@level:error,warn -health @user_id:42' --tail 100
kuiper logs -u web -f -q '@rid:r-1003'
kuiper logs -q (or --filter) takes the same filter and prints the last --tail matching lines. With -f it follows. The API is GET /v1/projects/{project}/units/{unit}/logs?q=…, and it answers with how many lines matched and were scanned. GET /v1/builds/{id}/log?q=… does the same for a build, and both have a /download form that returns the whole log as a file.
The filter language#
One small language is used everywhere: the log filter, the -q flag, and (in part) the palette. Terms are separated by spaces, and all of them must hold.
@level:error @user_id:42 timeout -health "connection reset"Words#
| You type | It matches |
|---|---|
timeout | Lines that contain timeout, in any case. |
"connection reset" | Lines that contain that exact phrase. |
-health | Lines that do not contain health. A leading - negates any term. |
A word searches the line without its timestamp and stream. ANSI colour codes are ignored, so ERROR printed in red still matches error.
Fields: @key:value#
@key:value matches one field of a line. Keys ignore case. The value can be:
| Value | It matches | Example |
|---|---|---|
text | That exact text, ignoring case. | @level:error |
a* | A wildcard. * matches anything. | @path:/api/*, @msg:*timeout* |
>n, >=n, <n, <=n | A number compared with the field. | @ms:>500 |
a..b | A number from a to b, inclusive. | @http.status:400..499 |
5xx | Shorthand for 500..599. | @http.status:5xx |
a,b,c | Any of the values. | @level:warn,error |
A number can end in ms or s (250ms, 1.5s); seconds are turned into milliseconds. A value with spaces goes in quotes: @msg:"two words". -@level:debug leaves debug lines out. A line that has no such field never matches a positive field term and always matches a negated one.
A malformed term (@level with no value, a number where text was expected) is an error shown next to the box, never a silent empty result.
Fields of runtime logs#
| Field | Also written | What it is |
|---|---|---|
@level | @lvl, @severity | trace, debug, info, warn, error or fatal. Read from a JSON level (a name, or a pino or bunyan number from 10 to 60), a logfmt level=, or the start of a plain line (ERROR …, [warn] …, Error: …). Names such as warning, err and critical map to these. A lower-case word in the middle of a sentence is not a level. |
@stream | @fd | stdout or stderr. |
@deployment | @dep | The deployment the log belongs to. @deployment:dep_x picks that deployment's log; wildcards and - are checked against the log being read. |
@rid | @request_id, @req_id | A request ID: a JSON rid or request_id key, or rid=… in a logfmt line. |
@message | @msg | A JSON message or msg, or the whole line when it is not JSON. |
@any.other.key | Any key of a JSON line, or any key=value pair of a logfmt line. A nested key is written with dots. |
A line is JSON when it is an object ({ … }). A line is logfmt when it has key=value pairs (level=info msg="two words" user_id=7).
Fields of build logs#
| Field | What it is |
|---|---|
@level | As above. error: …, npm ERR! and npm WARN count. |
@line | The line's number in the log. @line:>100 skips the first 100. |
@message, @msg | The line. |
Build logs have no streams and no JSON attributes, so any other @key is an error.
Examples#
| Filter | Finds |
|---|---|
@level:error | Every error line. |
@level:warn,error -@stream:stdout | Warnings and errors written to stderr. |
@http.status:5xx @path:/api/* | Server errors under /api, in JSON request logs. |
@user_id:42 -@level:debug | What one user did, without the debug noise. |
@rid:r-1003 | Everything one request logged. |
@ms:>1s "payment" | Slow lines that mention payment. |
-health -ping | Everything except health checks. |
Limits#
- A search reads the newest 20,000 lines the node holds. When the log is longer, Kuiper says it searched the newest lines.
- One answer carries at most 5,000 lines. A download carries the whole retained log (up to 200,000 lines).
- A node that runs an older kuiperd serves at most 5,000 lines per request, so a search or a download there covers the newest 5,000.
- Logs are filtered as stored: redaction of secret values is unchanged, and so is the text of every line.