Dashboard
Dashboard tour
Every page of the Kuiper dashboard and what it is for, from the project overview to logs, usage and the Inspect cards.
On this page
The dashboard lives at app.kuiper.sh. Everything it does, the CLI does too. The dashboard is the place to look at things: logs, runs, usage, and the state of your agents.
The layout#
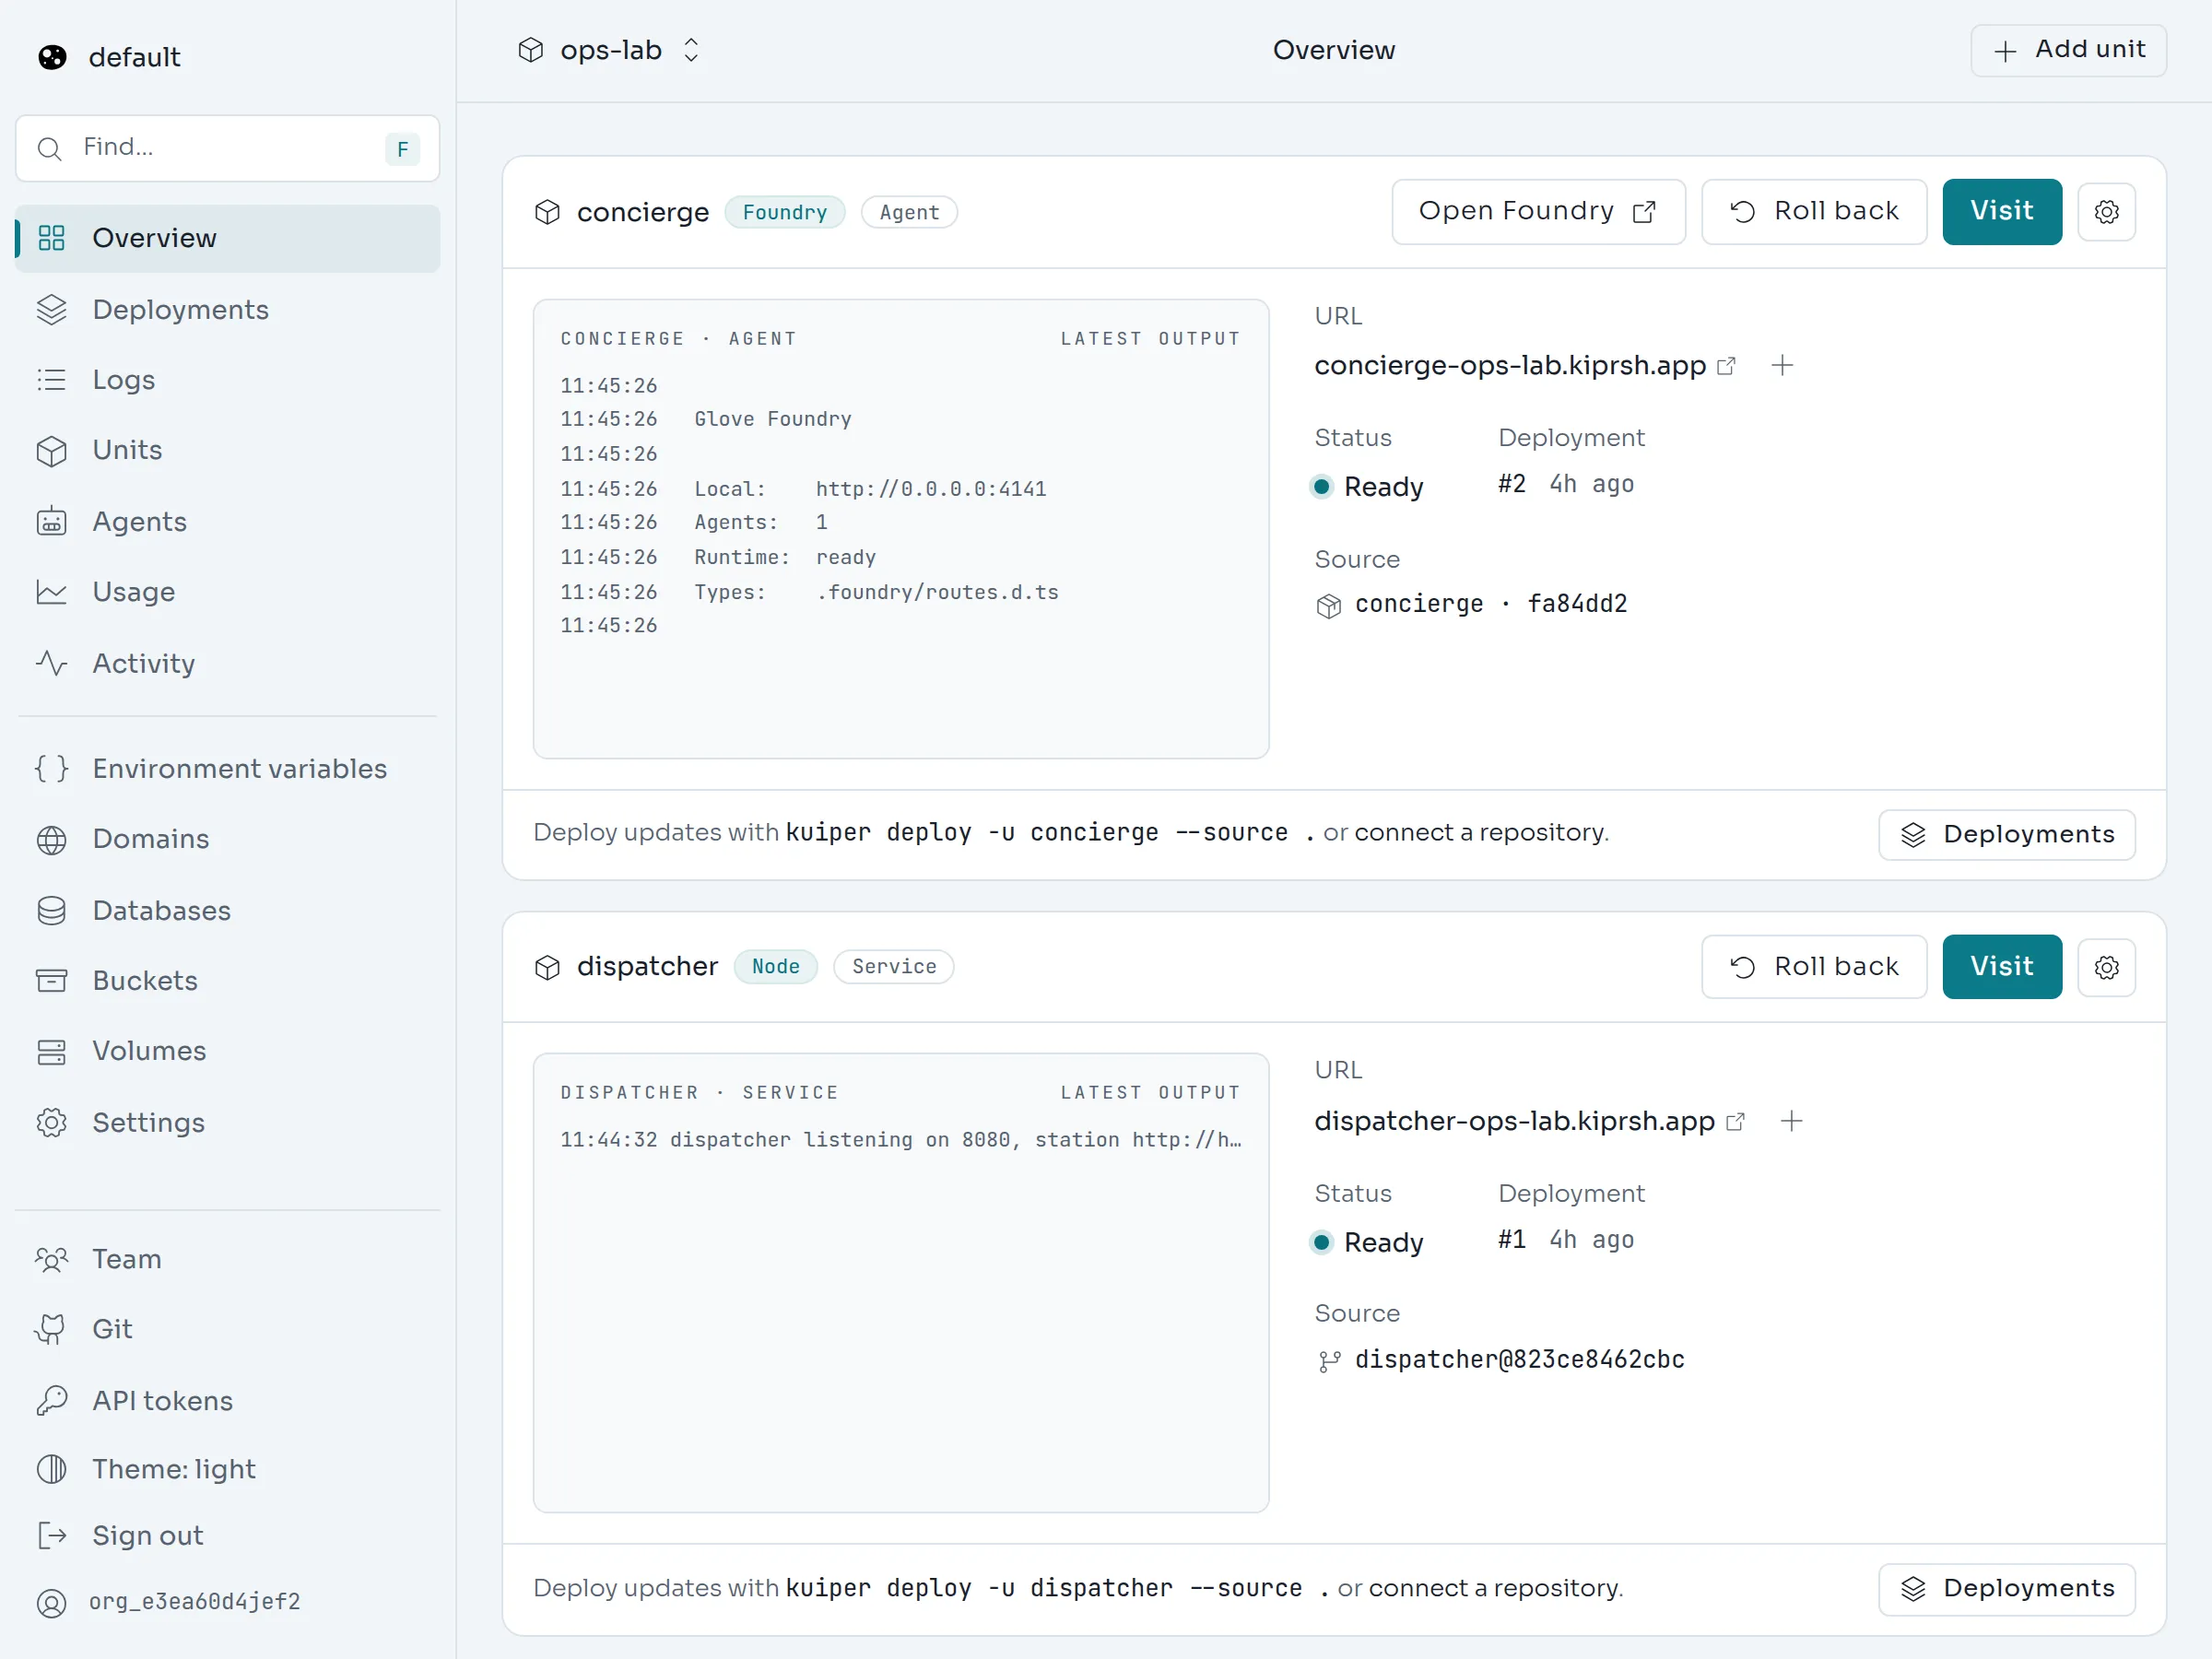
The sidebar on the left changes with where you are. At the top level it lists your projects. Inside a project it lists that project's pages. The bar above the content shows where you are, with a project switcher on the left and Add unit on the right.
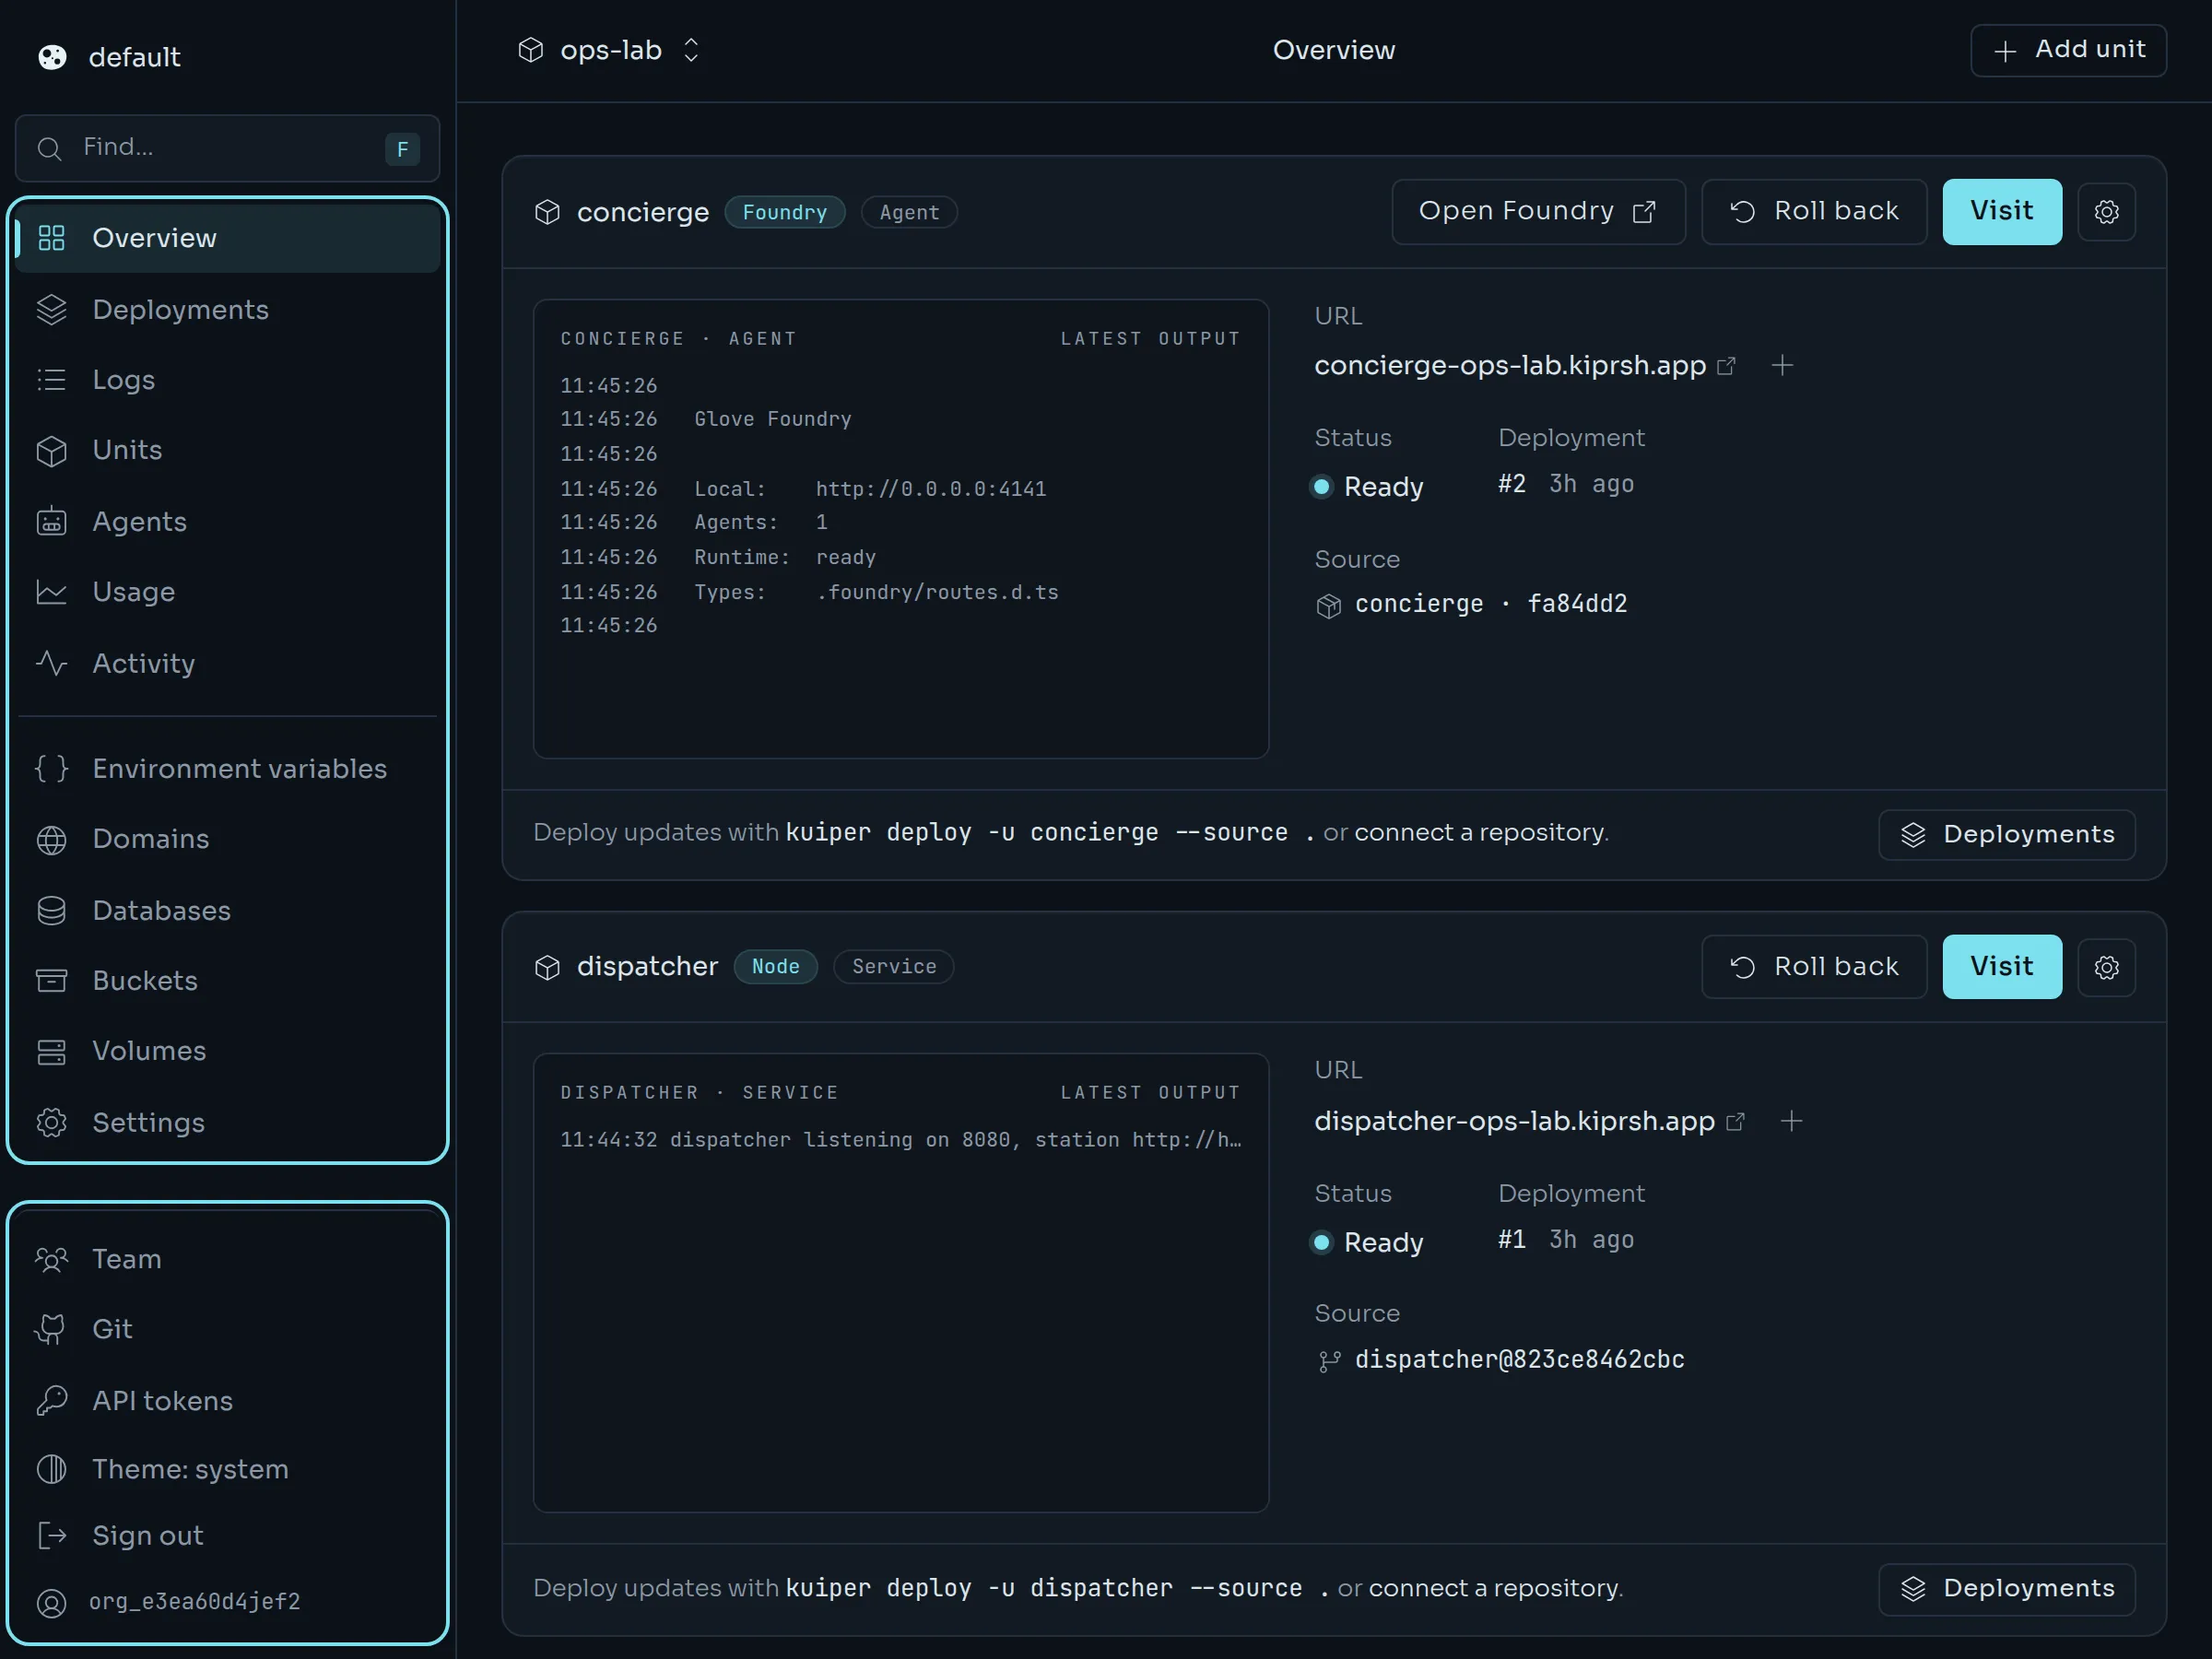
The project pages are:
| Page | What it shows |
|---|---|
| Overview | One card per unit with a log preview, its address and its live deployment. |
| Deployments | Every build and deployment of the project, newest first. |
| Logs | Live output from any unit. |
| Units | A table of units, and a form to create one. |
| Agents | Runs and health of every Foundry and Station unit. |
| Usage | CPU and memory, used and reserved, plus agent activity. |
| Activity | A feed of what happened in the project. |
| Environment variables | Variables for each unit. |
| Domains | Your own hostnames. |
| Databases | Managed Postgres and Redis. |
| Buckets | S3-compatible object storage. |
| Volumes | Persistent disks. |
| Settings | Default region, auto-restart, private registries and deleting the project. |
The links at the bottom of the sidebar are for the whole organisation: Team, Git, API tokens, the Account page, the colour theme and Sign out.
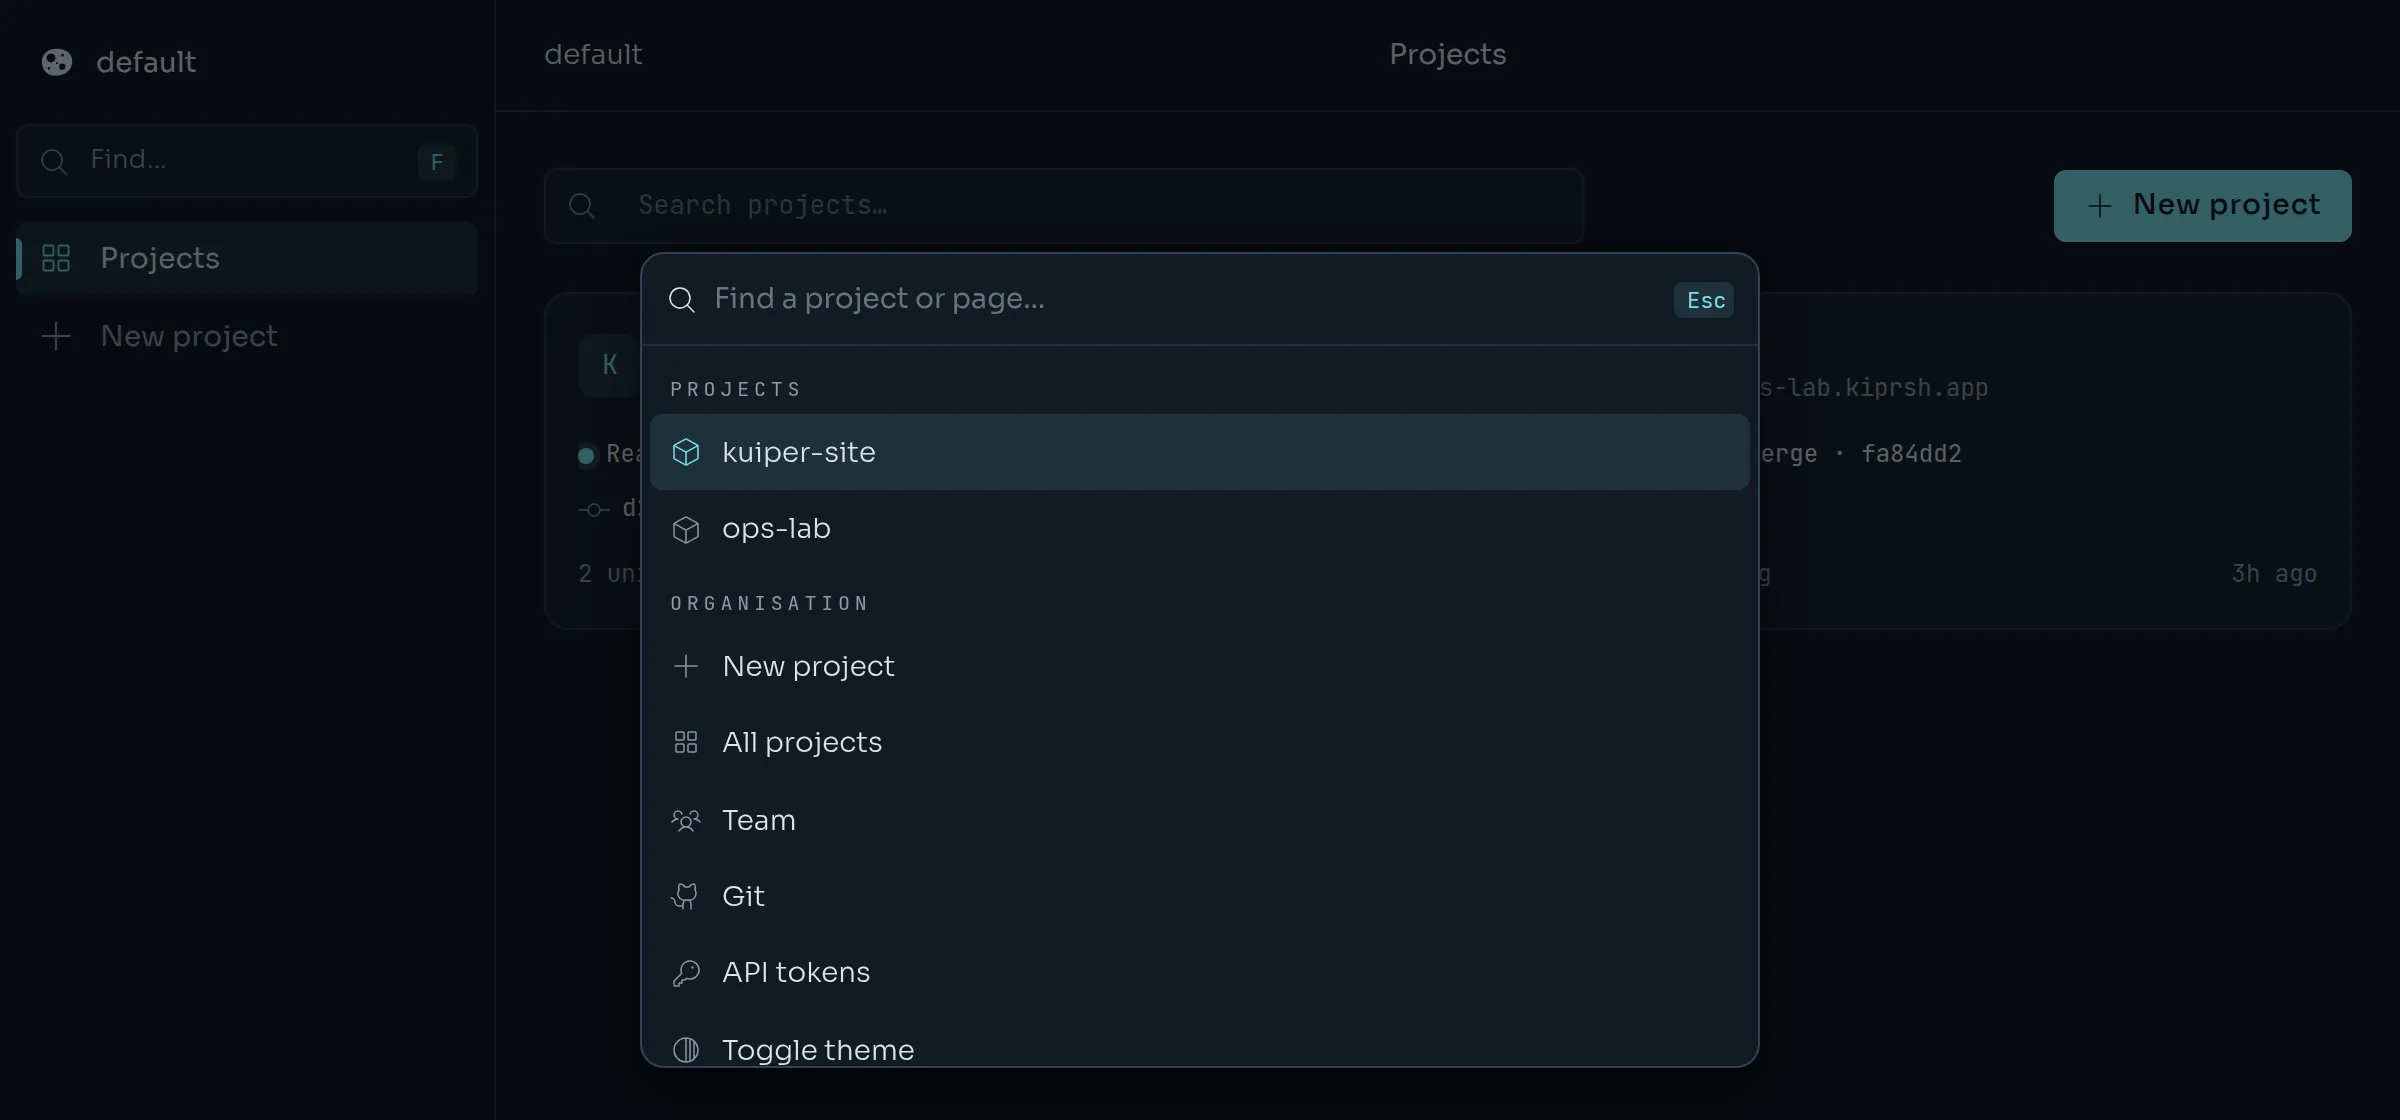
Find anything#
Press F or Ctrl + K (⌘ + K on a Mac) to open Find. Type a project or a page name and press Enter.
Projects#
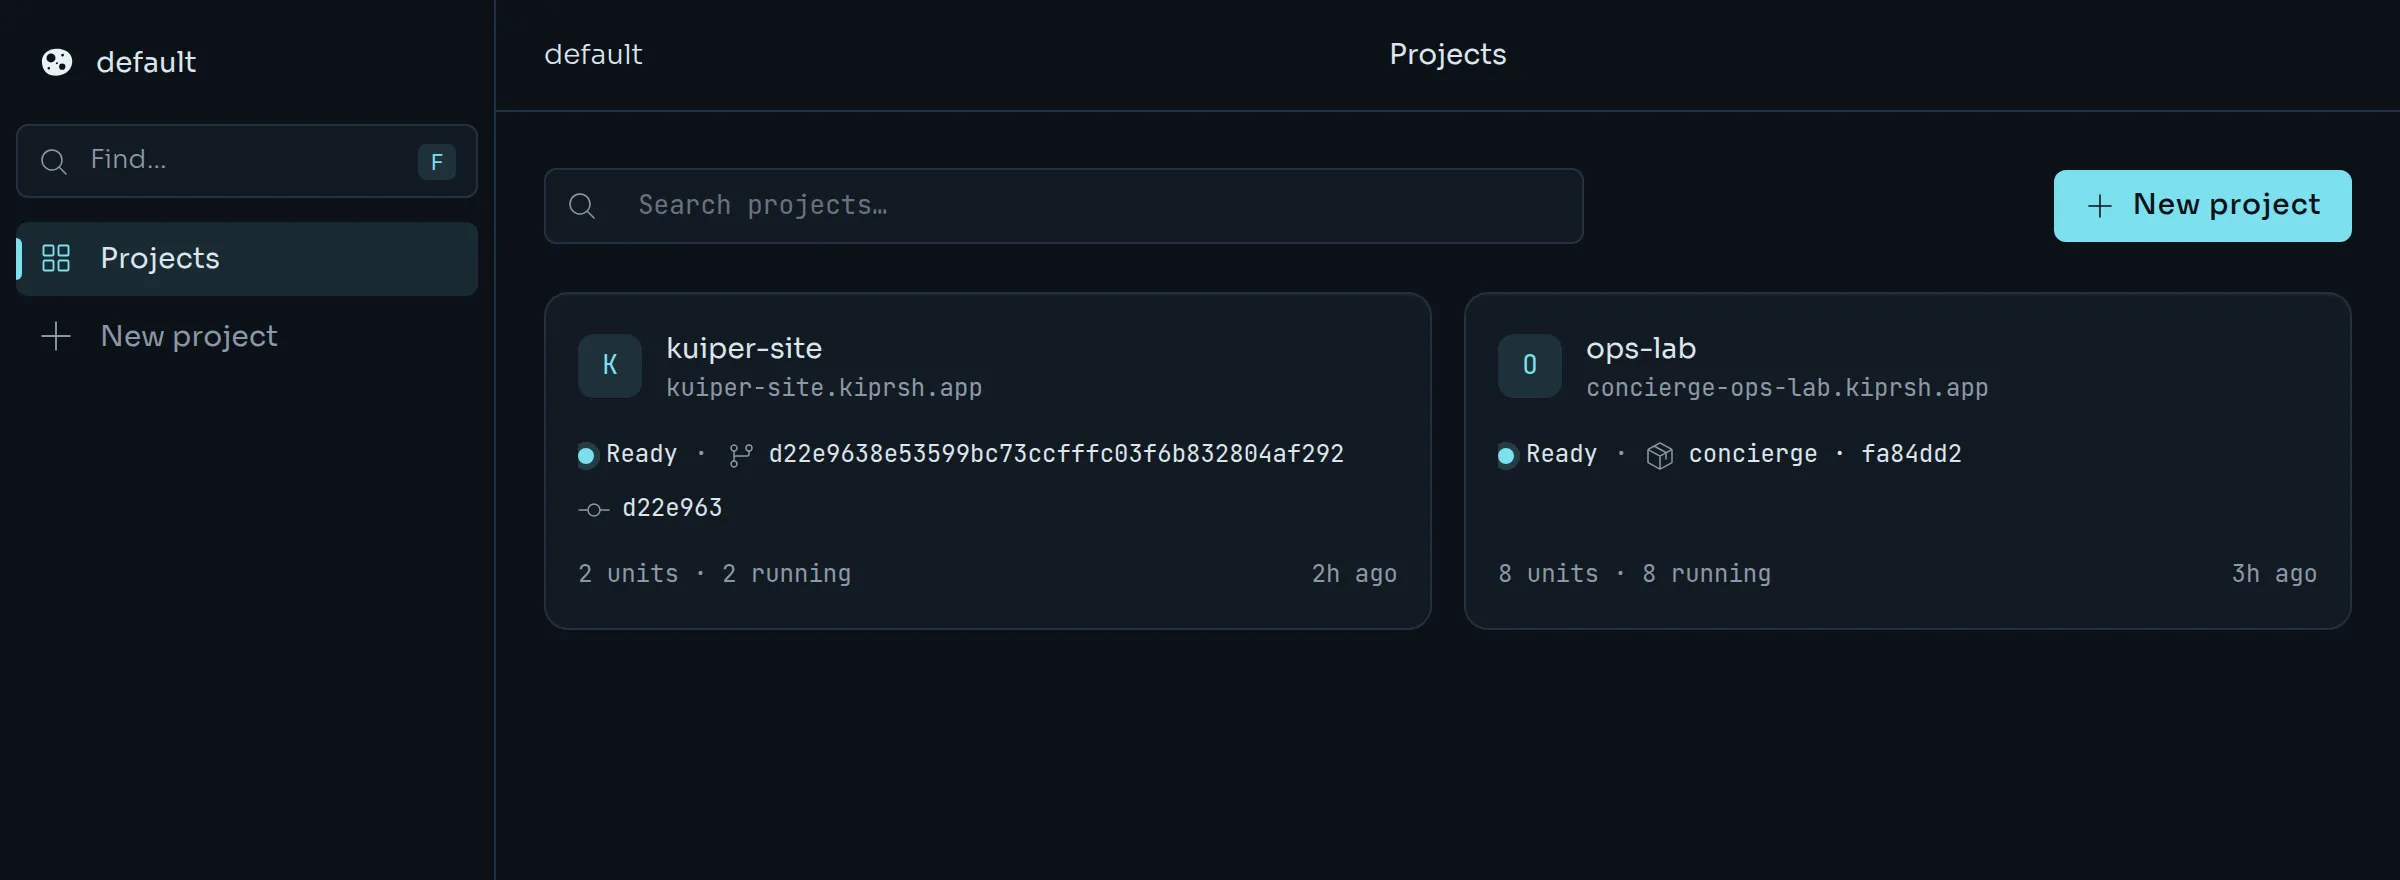
The first page lists your projects as cards. Each card shows the project's status, how many units it has and how many are running, and when it last changed. Use the search box to filter, and New project to start another.
Project overview#
Open a project and the overview shows each unit as a card. The card previews the unit's latest log lines, and shows its address, its status and the deployment that is live.
- Visit opens the unit's address.
- Roll back redeploys the previous deployment. See Rollbacks.
- Open Foundry or Open dashboard appears on Foundry and Station units. It opens the framework's own web interface.
- The gear opens the unit's page.
A new project also shows a short checklist: deploy a unit, connect a Git repository, add a secret, add a custom domain and turn on auto-restart.
Units#
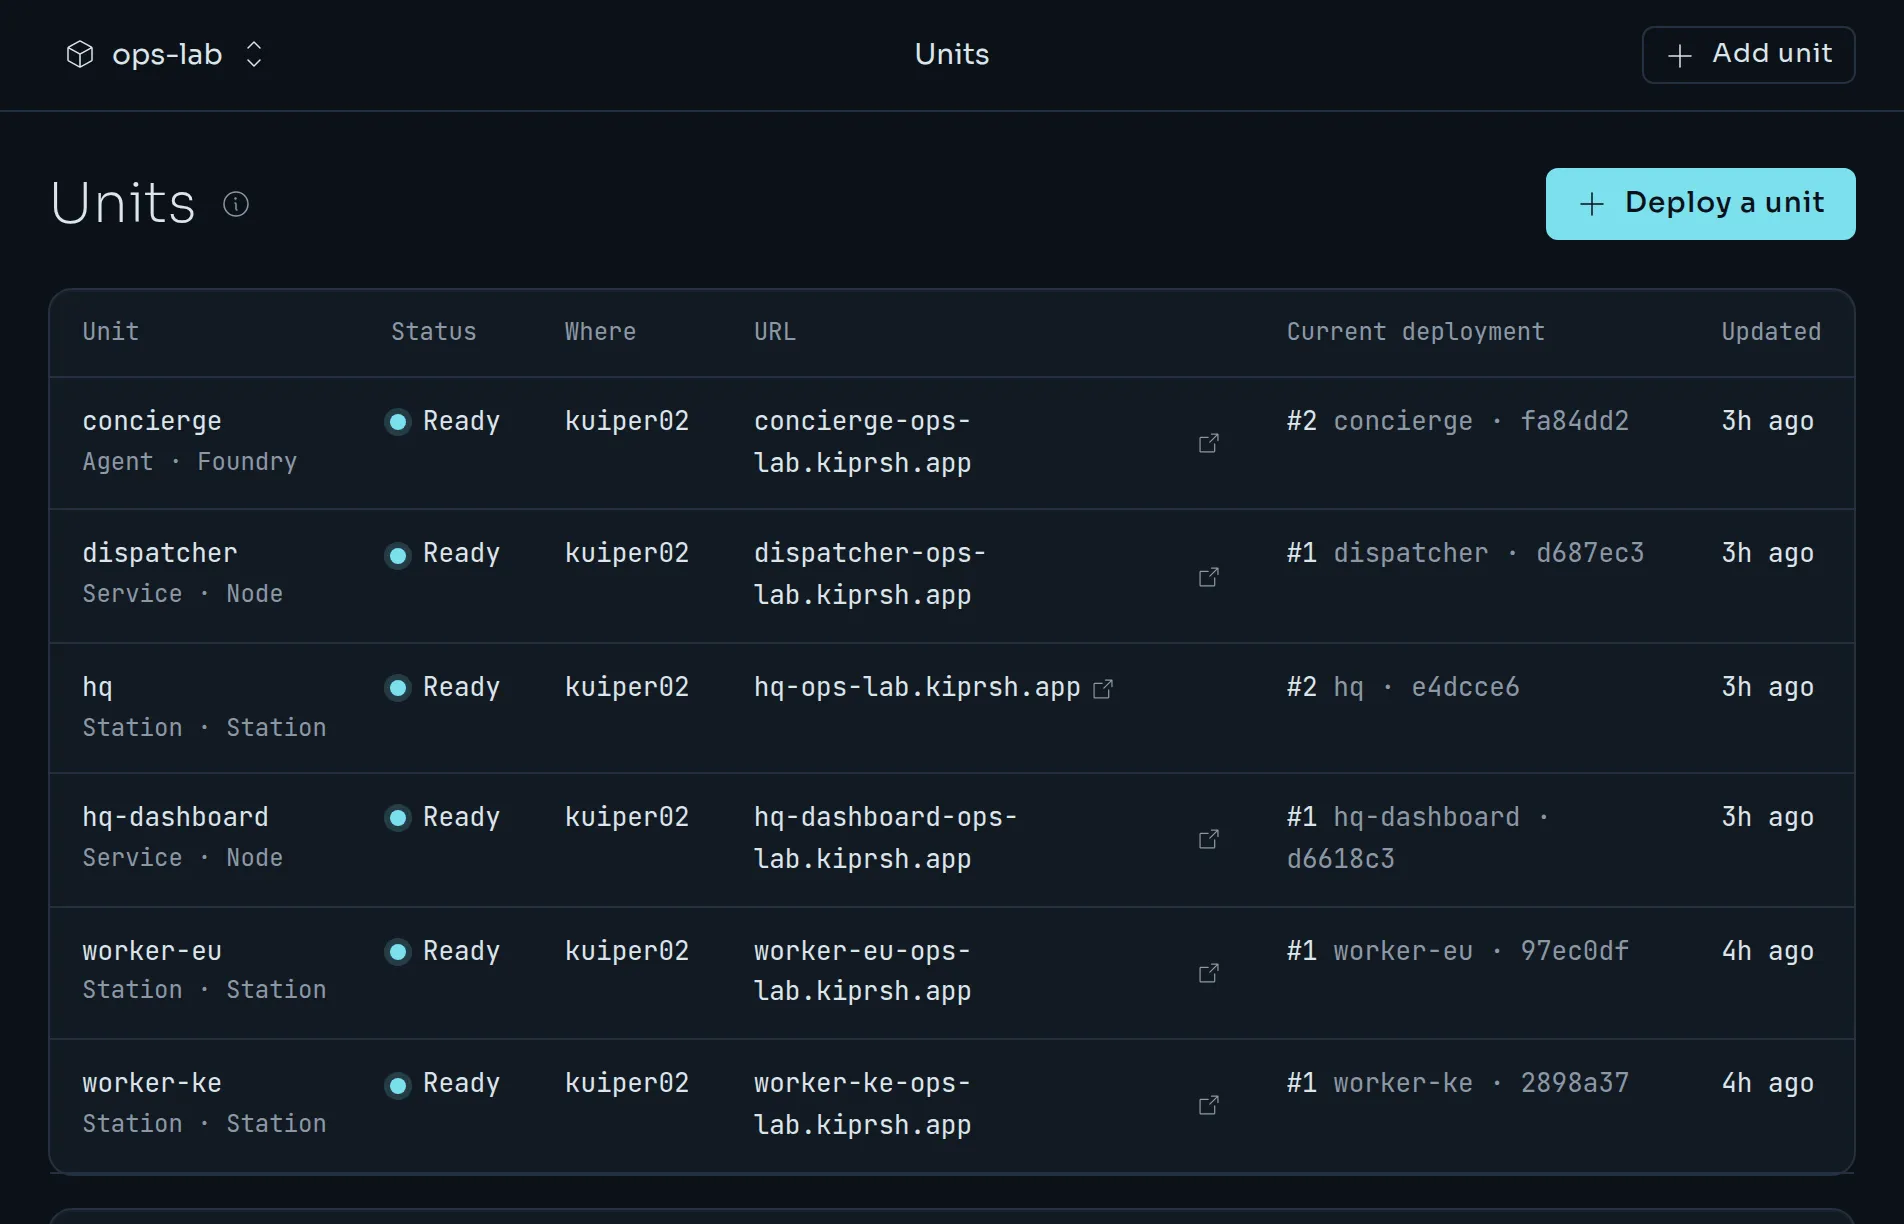
The Units page is a table. Each row shows a unit's kind, status, the node it runs on, its address, its current deployment and when it last changed. Below the table, a form creates a unit with a name and a type: agent, Station or service.
The unit page#
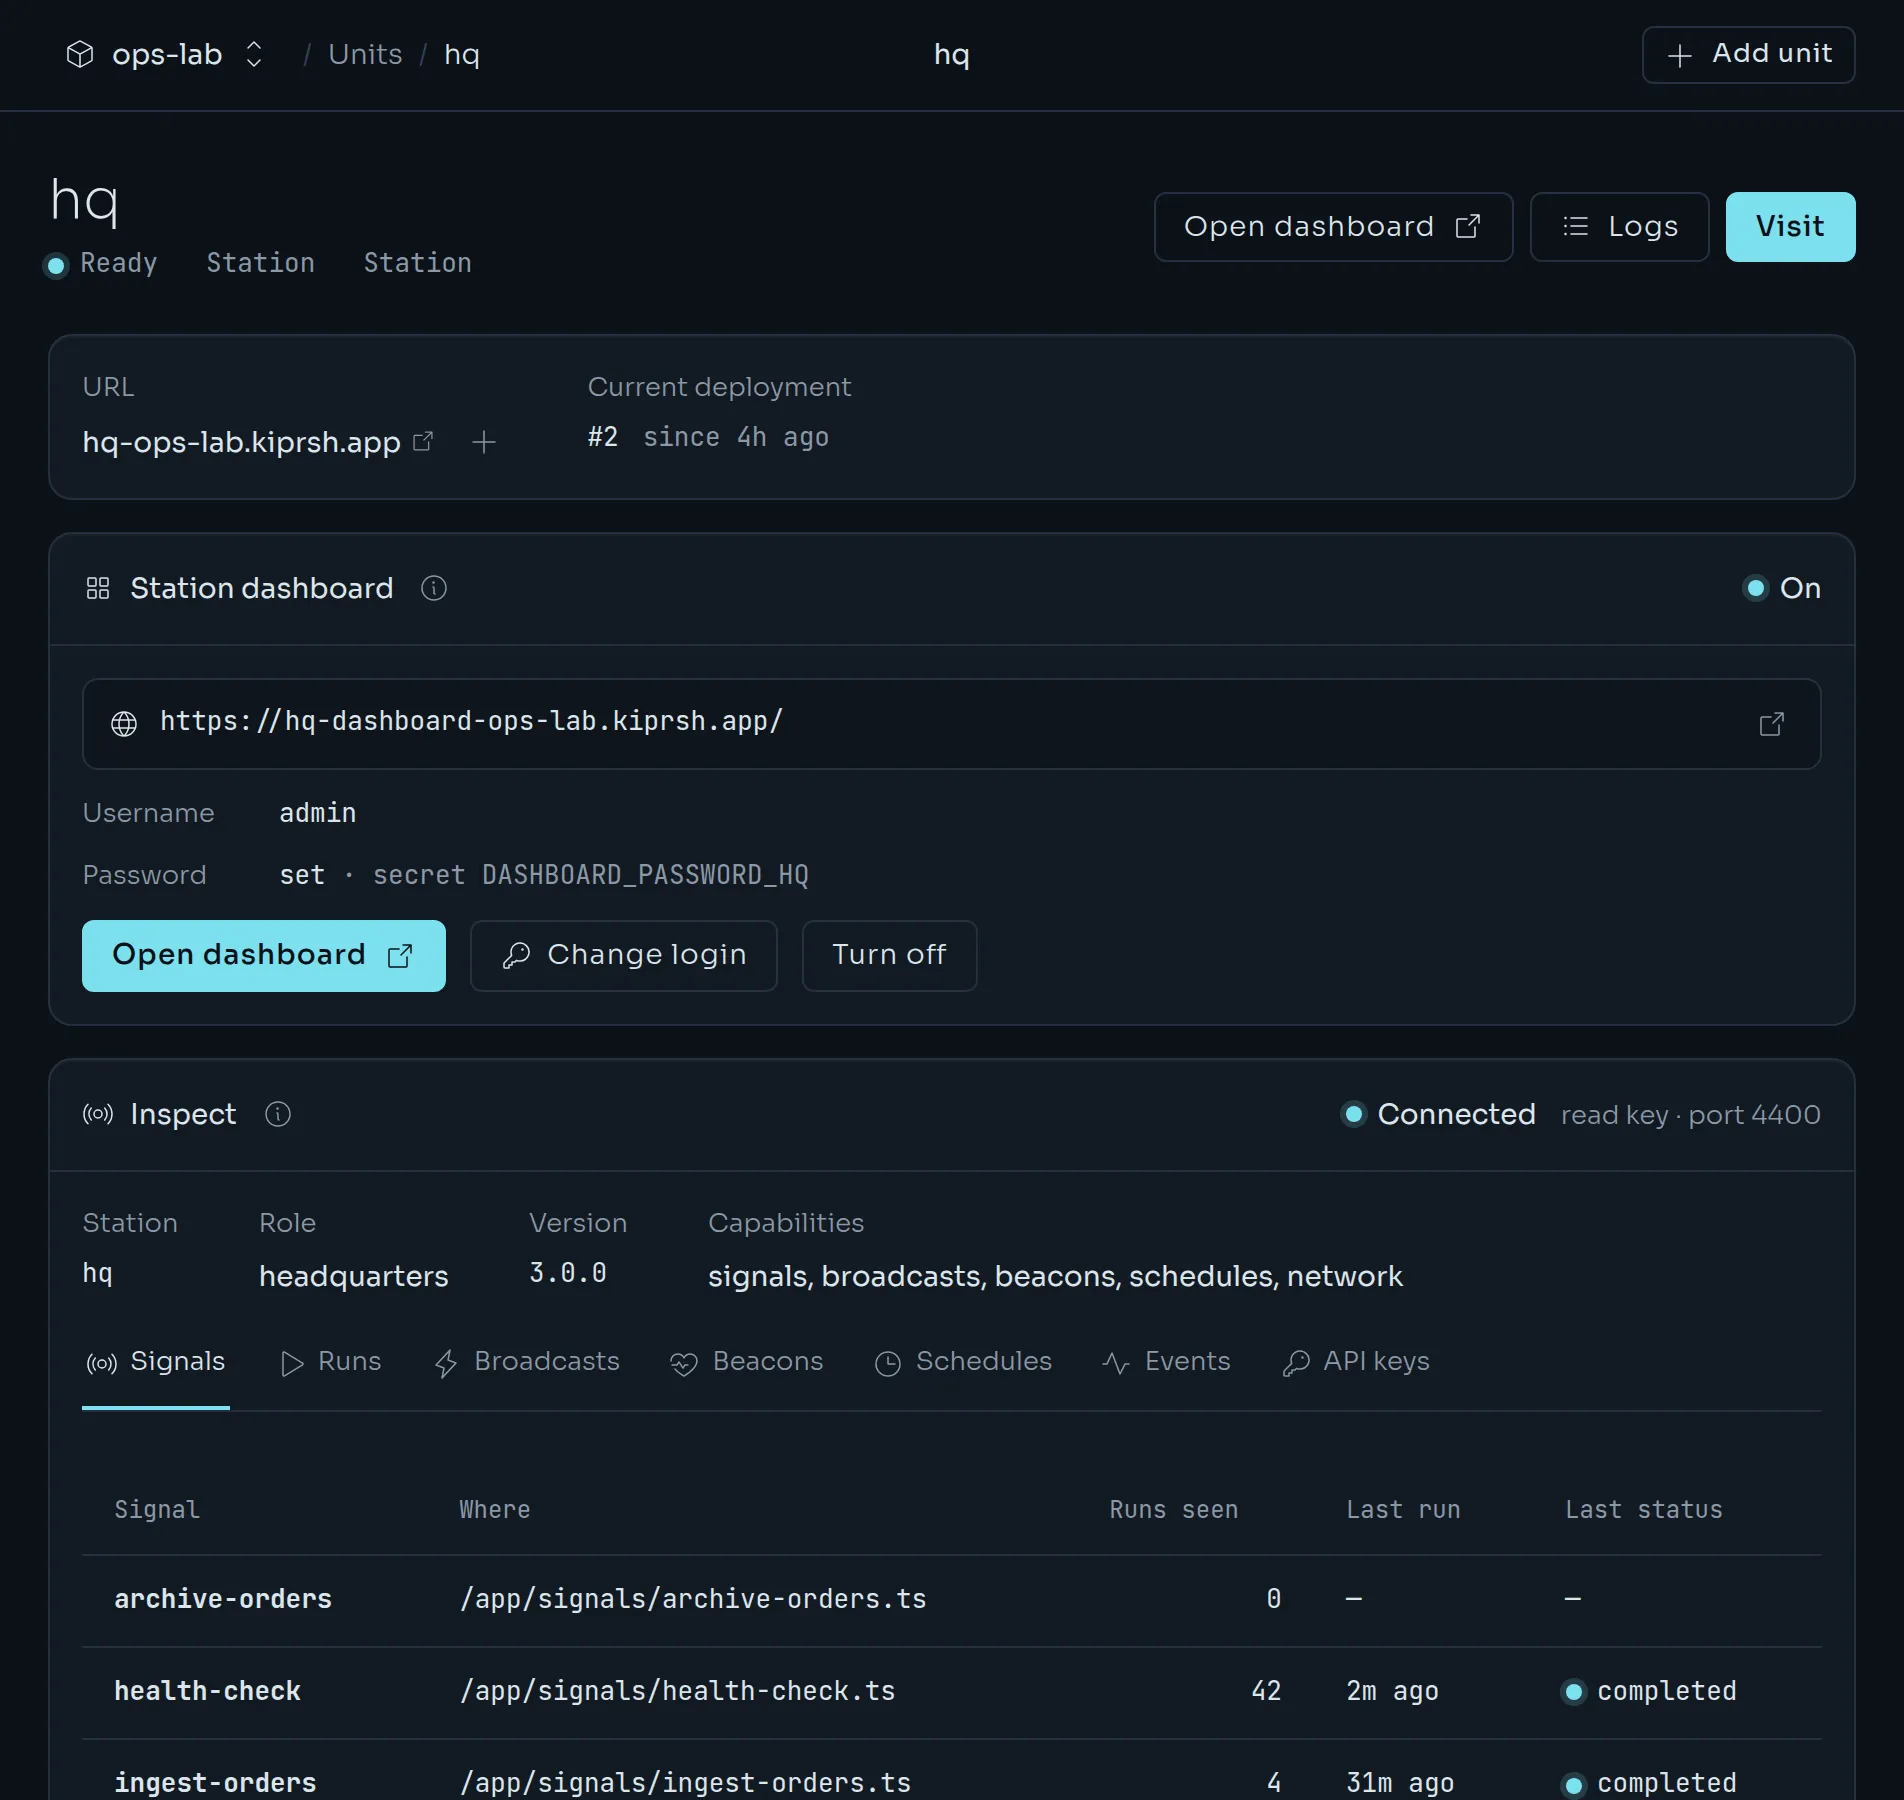
Click a unit to open its page. From top to bottom it has:
- the unit's status and kind, with Visit, Logs and, for Foundry and Station, a button to open the framework's dashboard;
- the unit's address and its current deployment;
- on Station and Foundry units, the dashboard card and the Inspect card, described below;
- the unit's Deployments;
- Source, where you connect a Git repository or drop in a folder to deploy;
- Build and run settings;
- the Environment of the live deployment, with a shortcut to edit it;
- Advanced, with where the unit runs, a form to deploy an image and the unit ID.
Inspect cards#
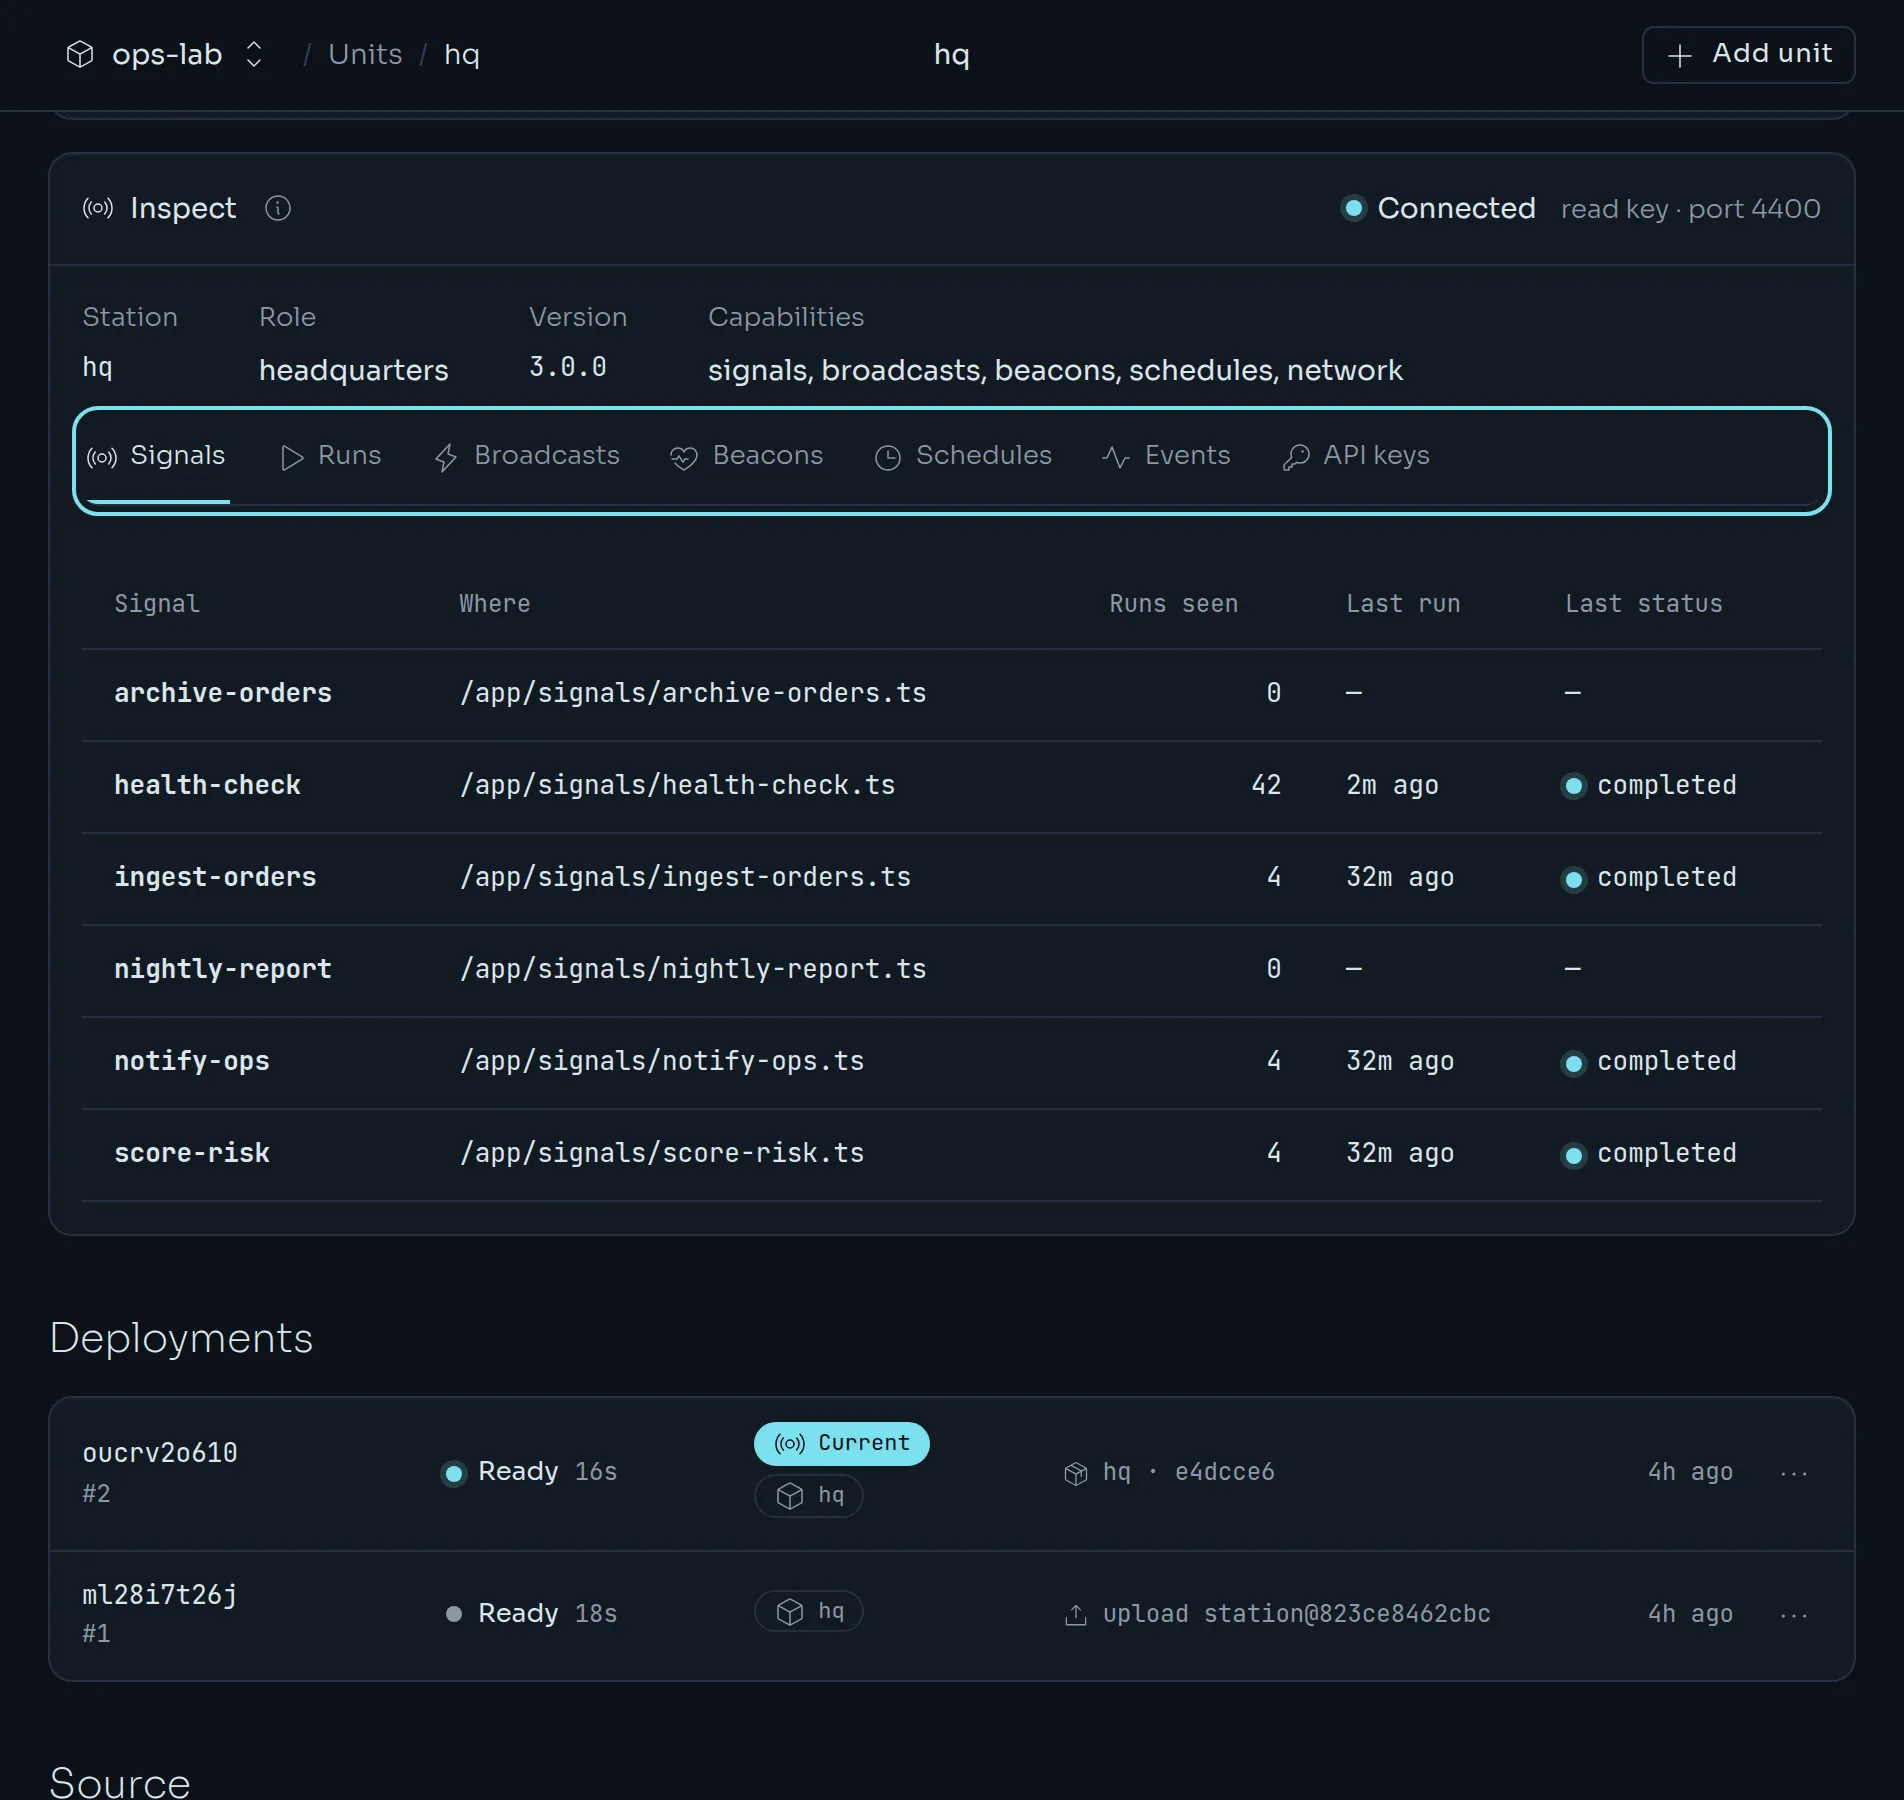
Station and Foundry units have an Inspect card. It reads the agent's own API through the node it runs on, so you see real runs without wiring up a thing. Kuiper holds the credentials. Your browser never sees them, and only reads are possible.
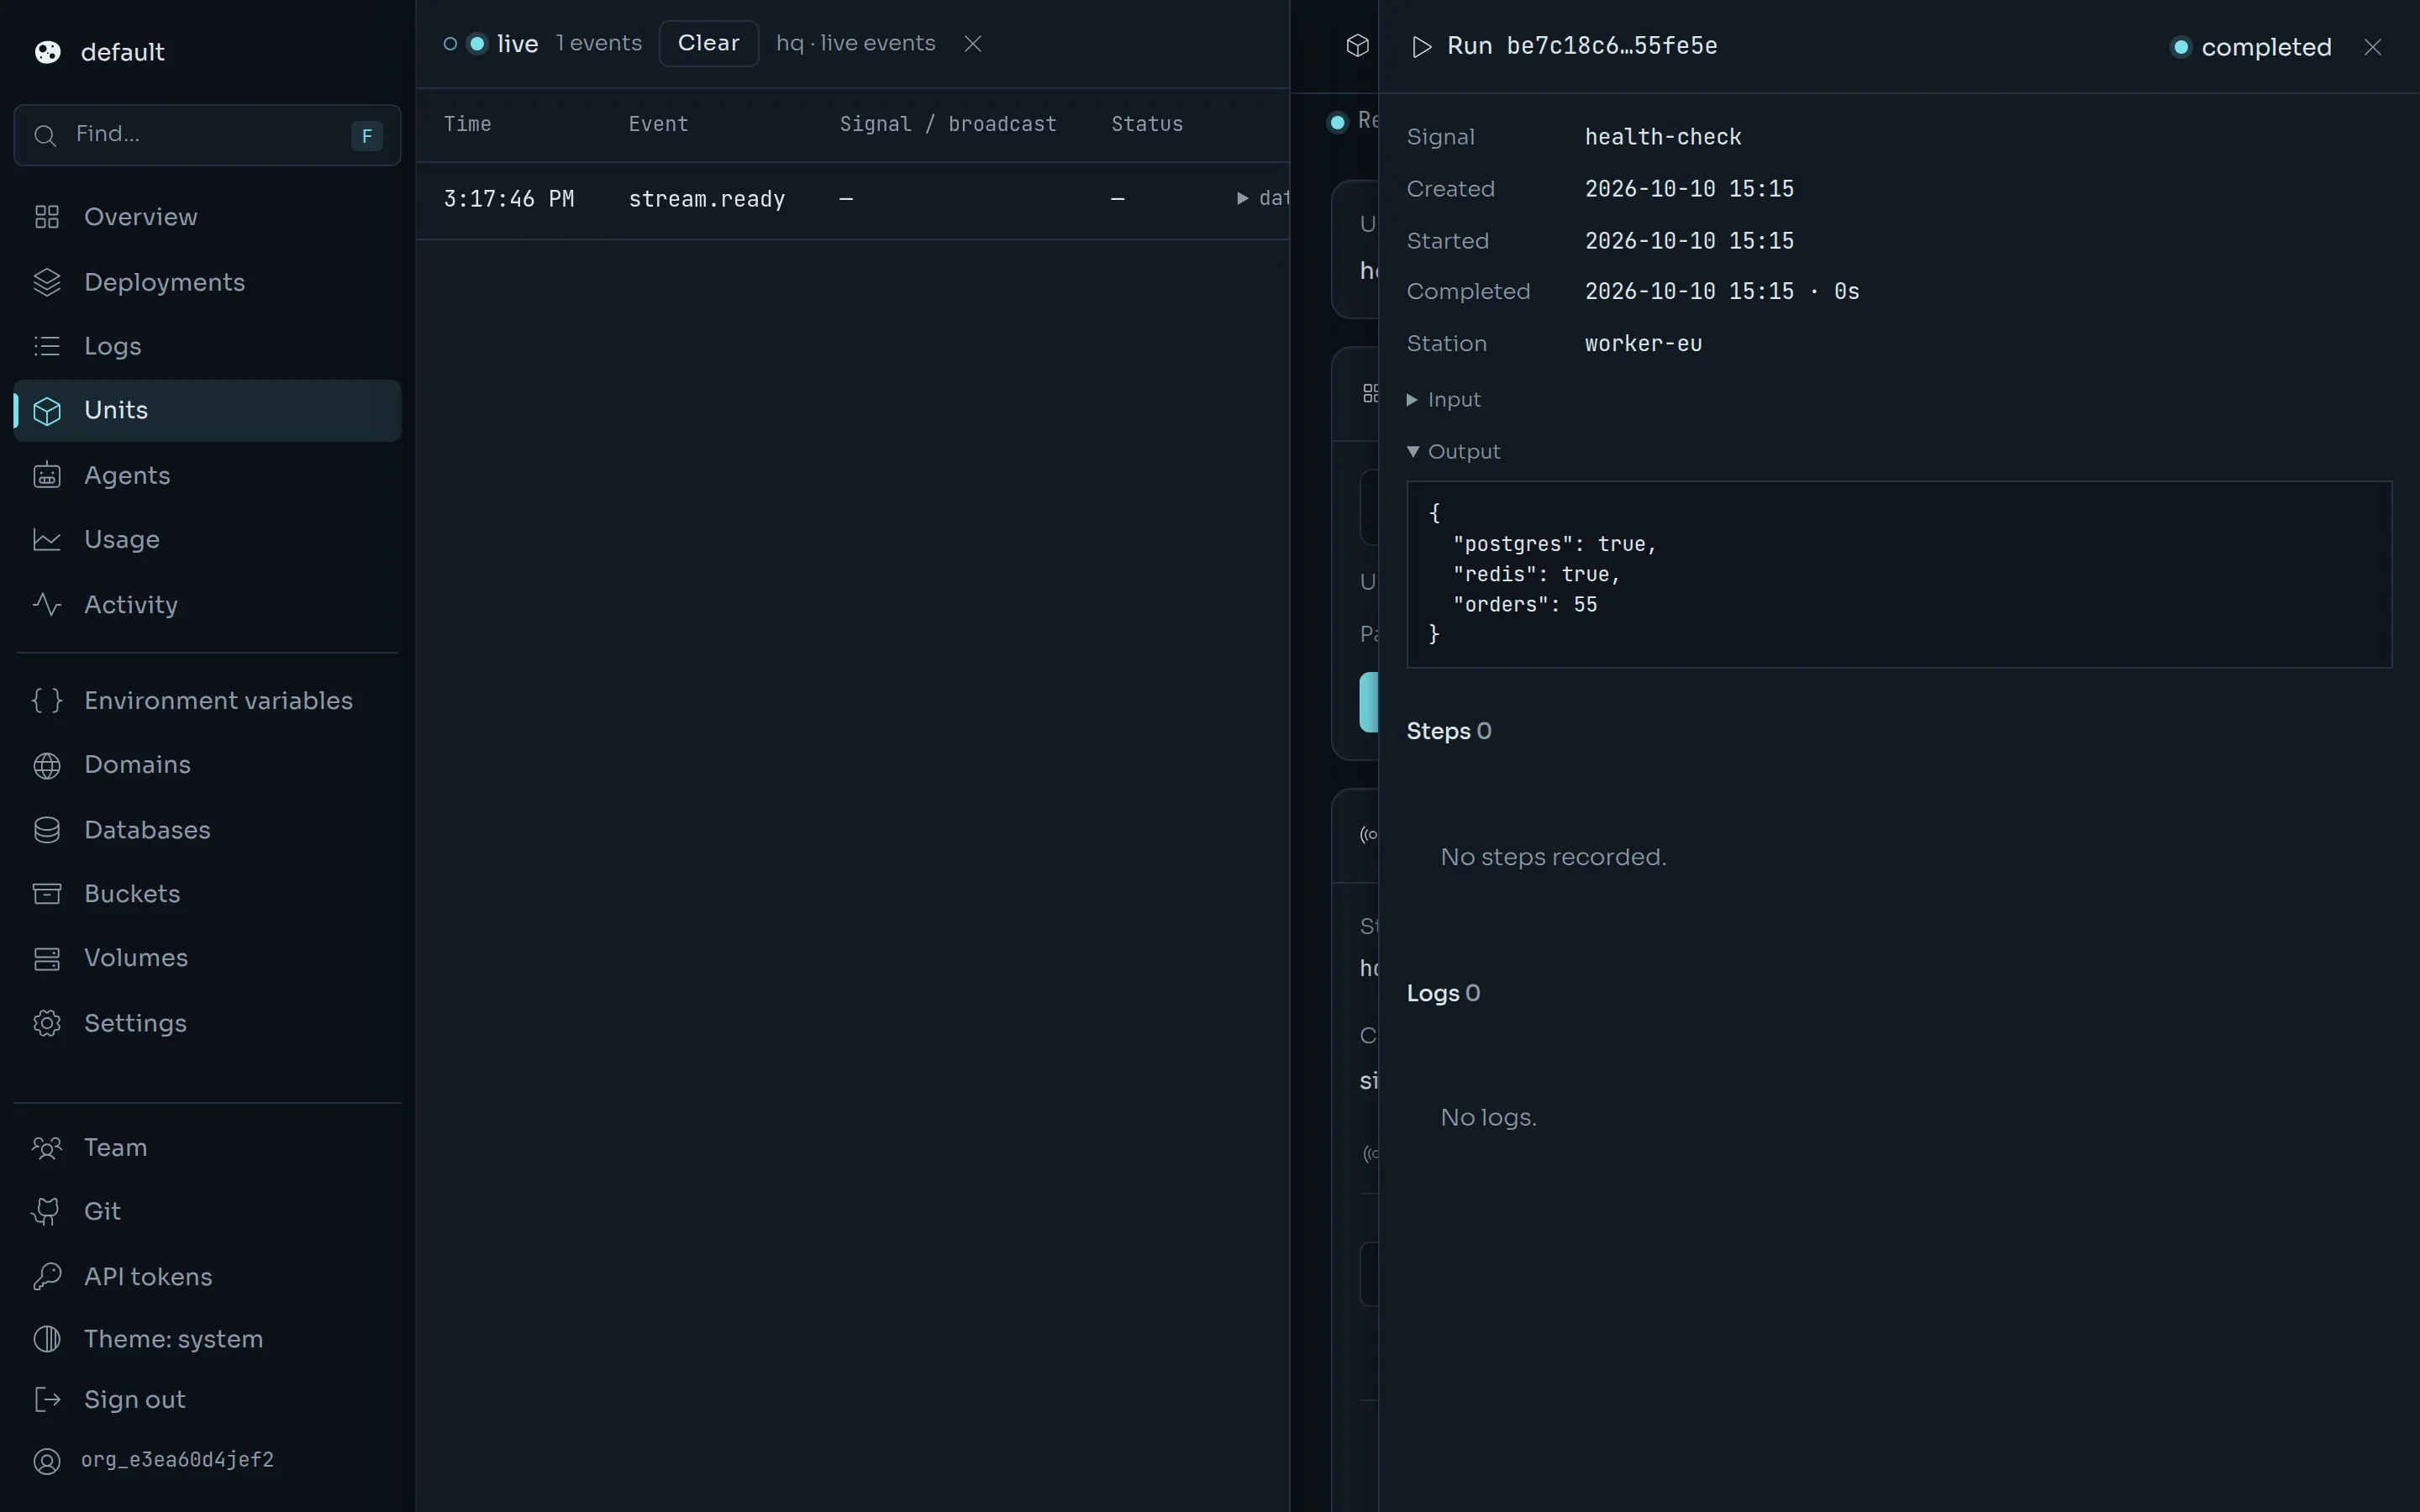
A Station card has tabs for signals, runs, broadcasts, beacons, schedules, live events and API keys.
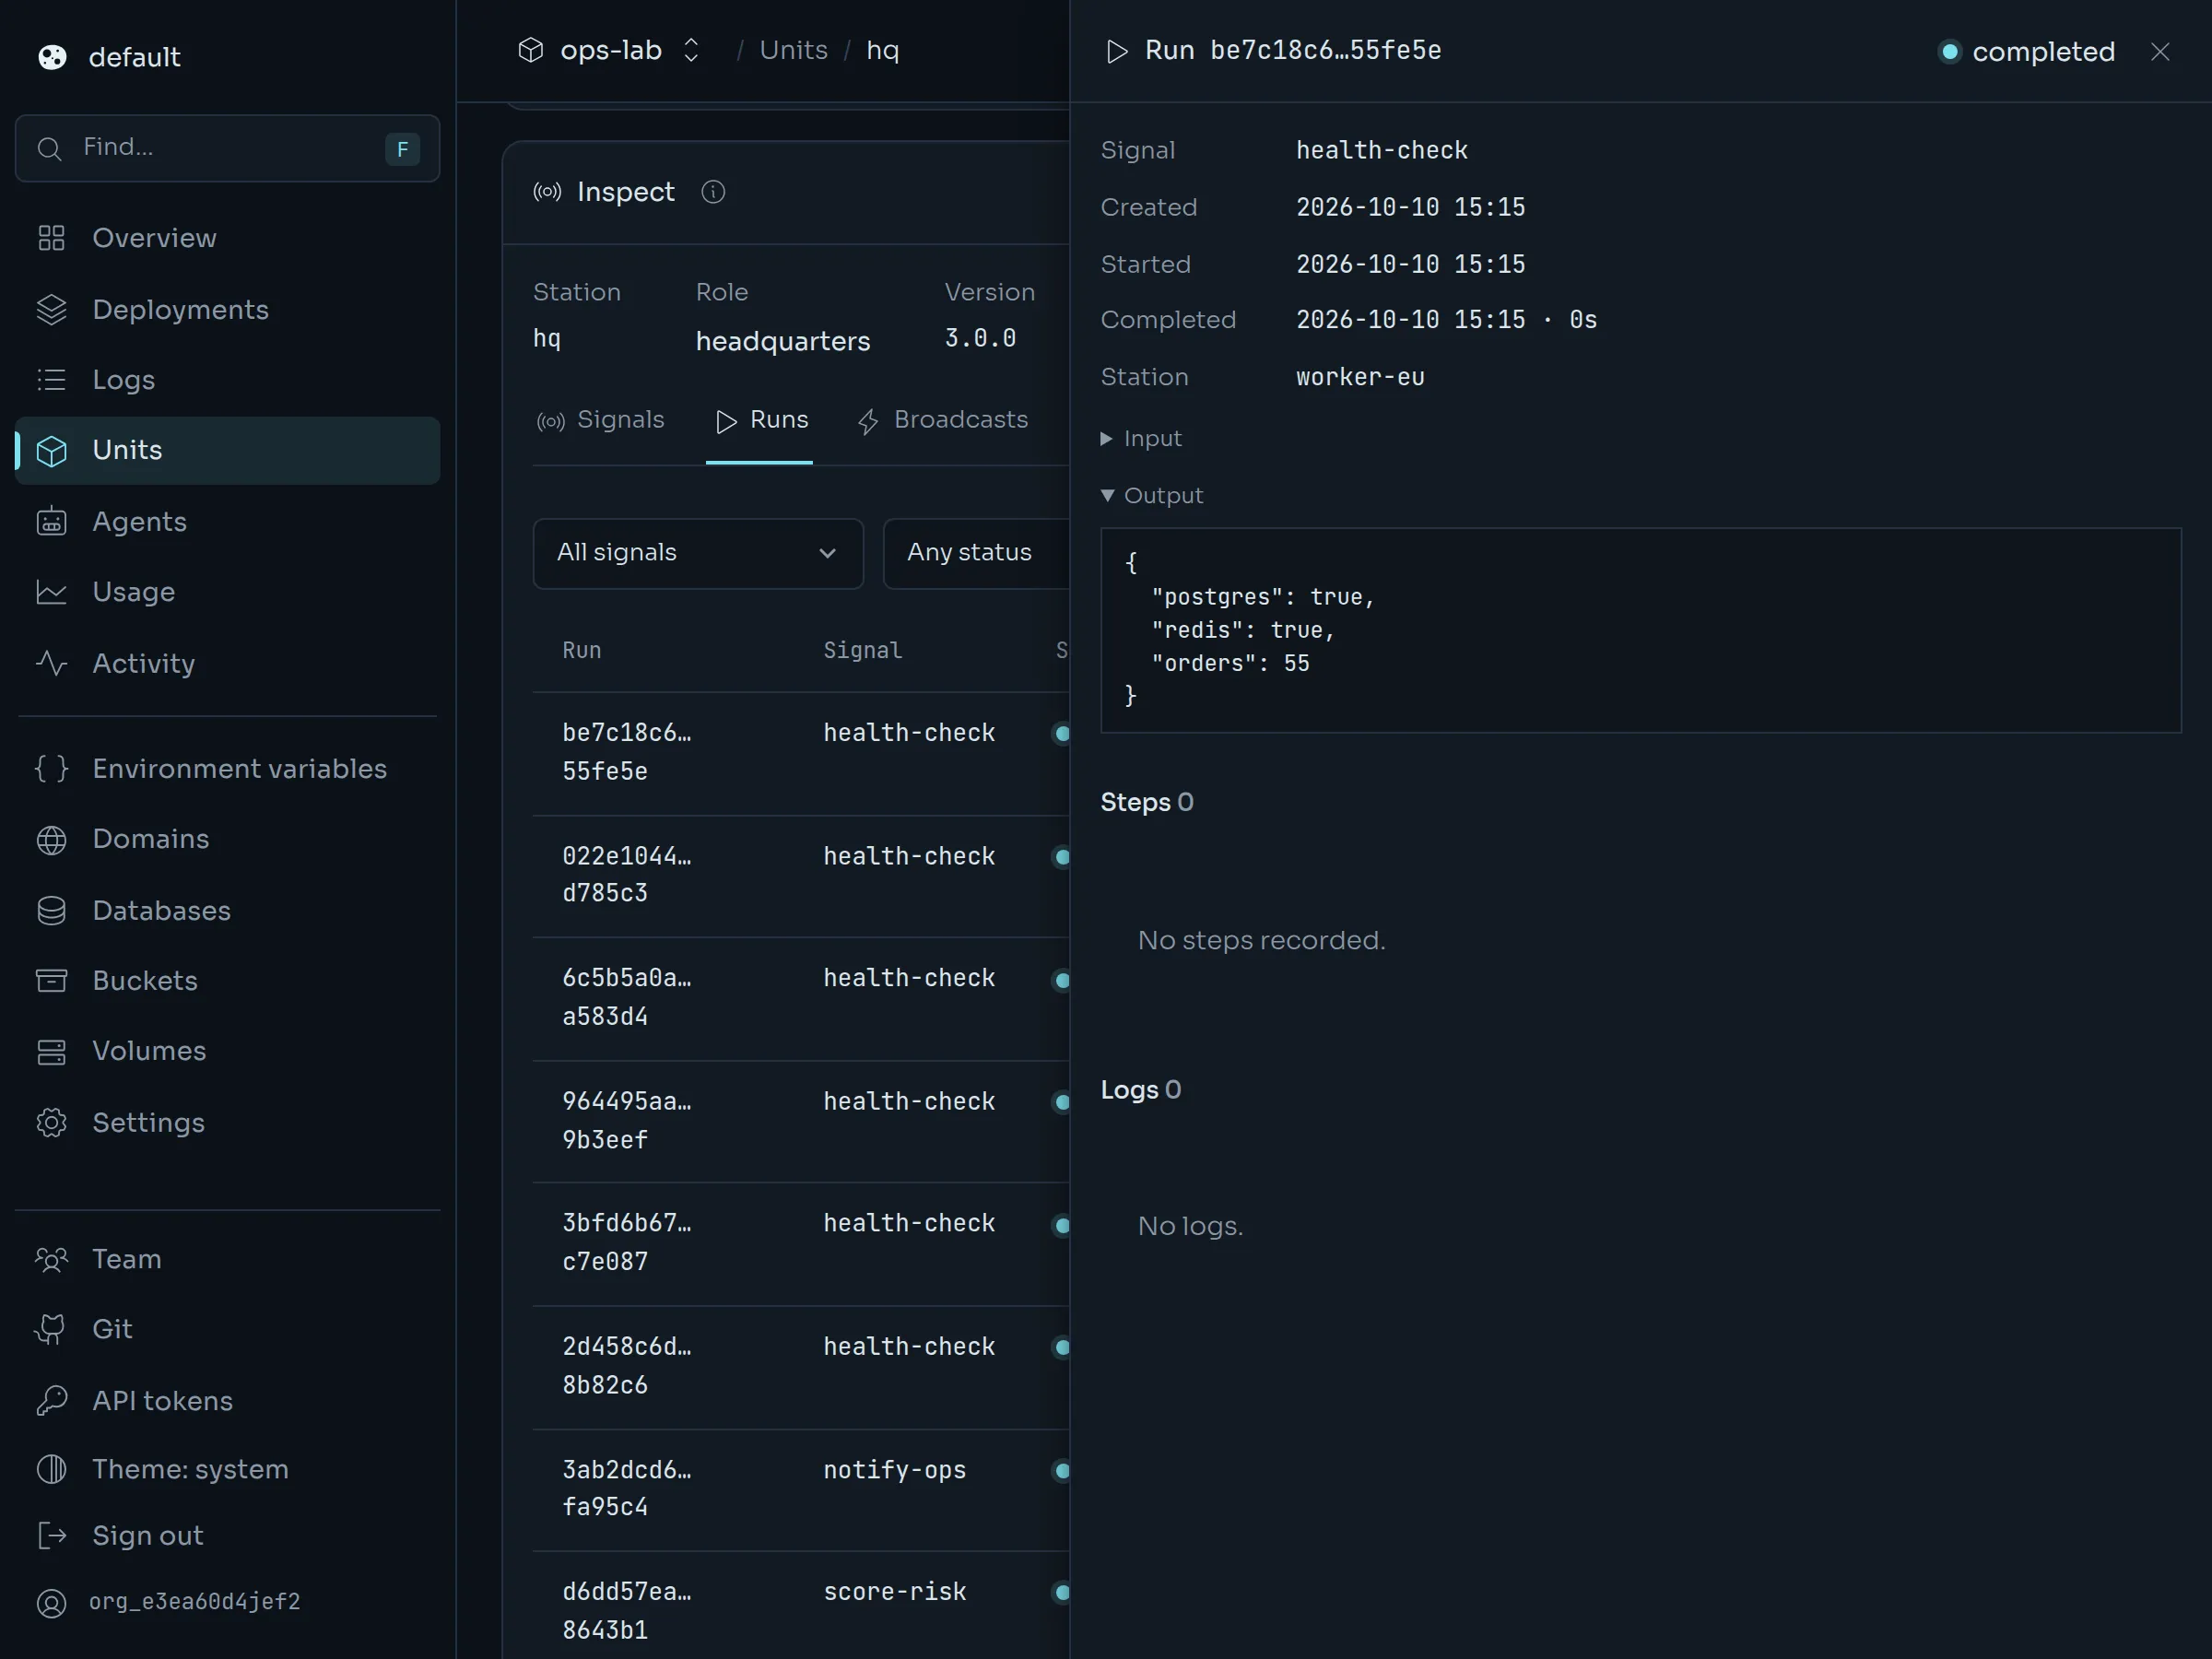
Click a run, a broadcast run or a beacon instance and its details open in a drawer on the right. The list stays where it was. Close the drawer with the X or with Esc.
The Events tab streams live events from the daemon. Press Pin to side and the stream moves to a drawer on the left. It keeps streaming while you look at runs and beacons.
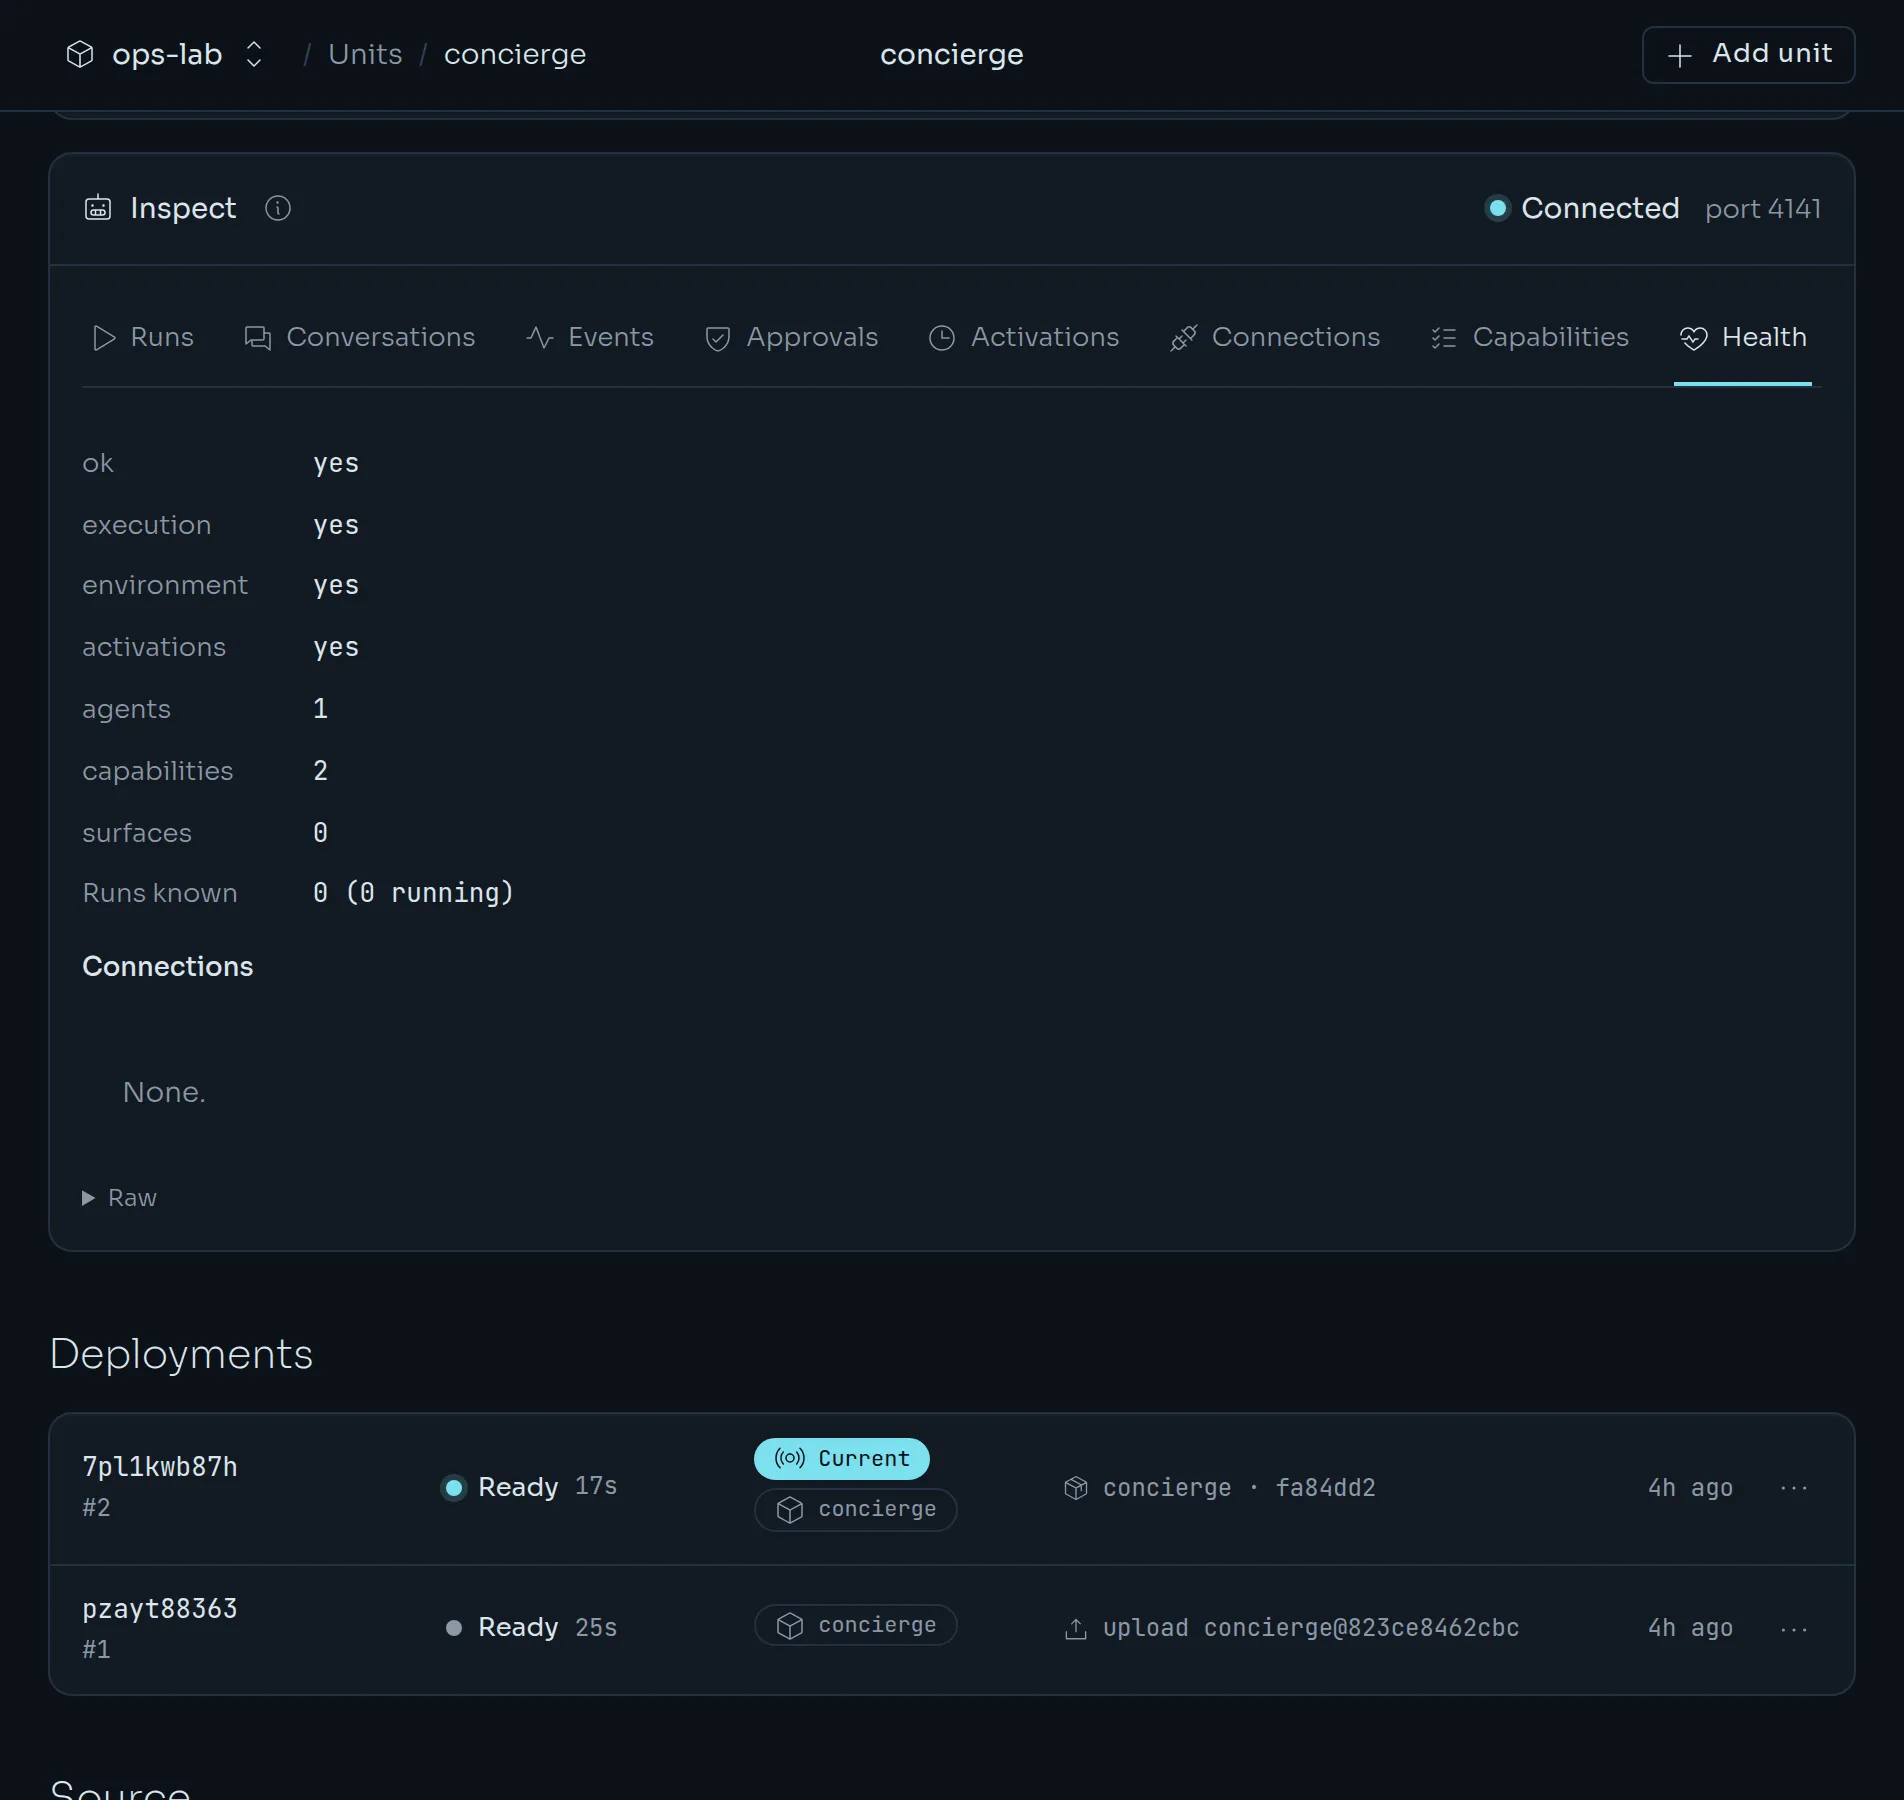
A Foundry card has tabs for runs, conversations, events, approvals, activations, connections, capabilities and health.
The API keys tab of a Station card lists and mints keys for other services. See Station units.
Deployments#
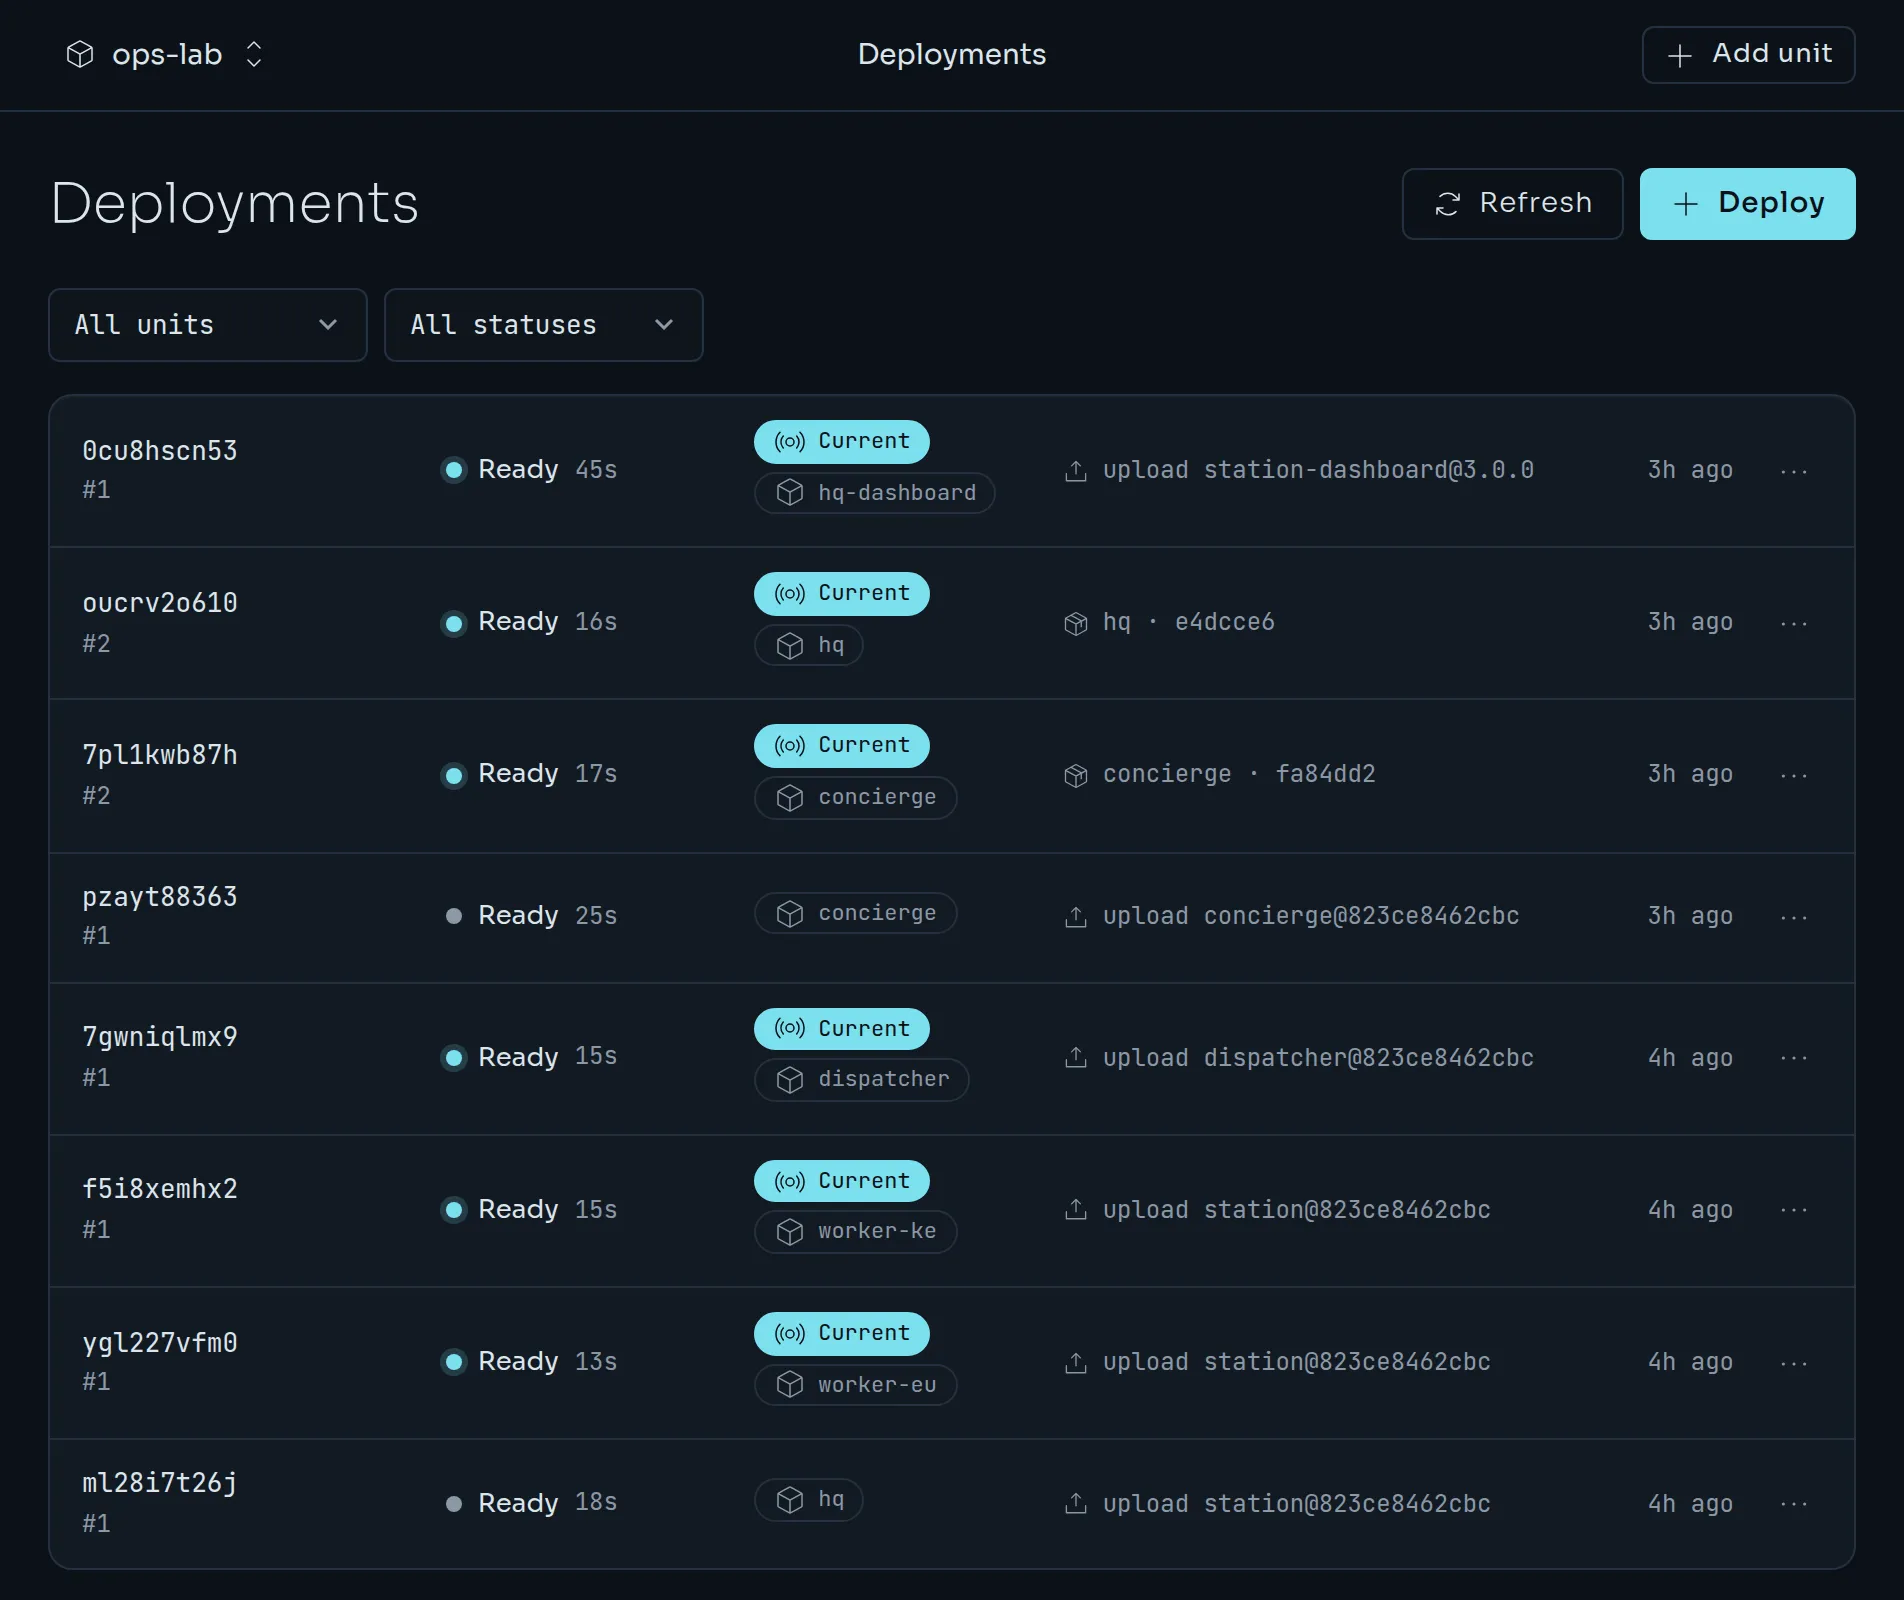
The Deployments page lists every deployment, and the builds that have not produced one yet. Filter by unit or status. The menu at the end of a row can inspect, redeploy or roll back, and copy the ID.
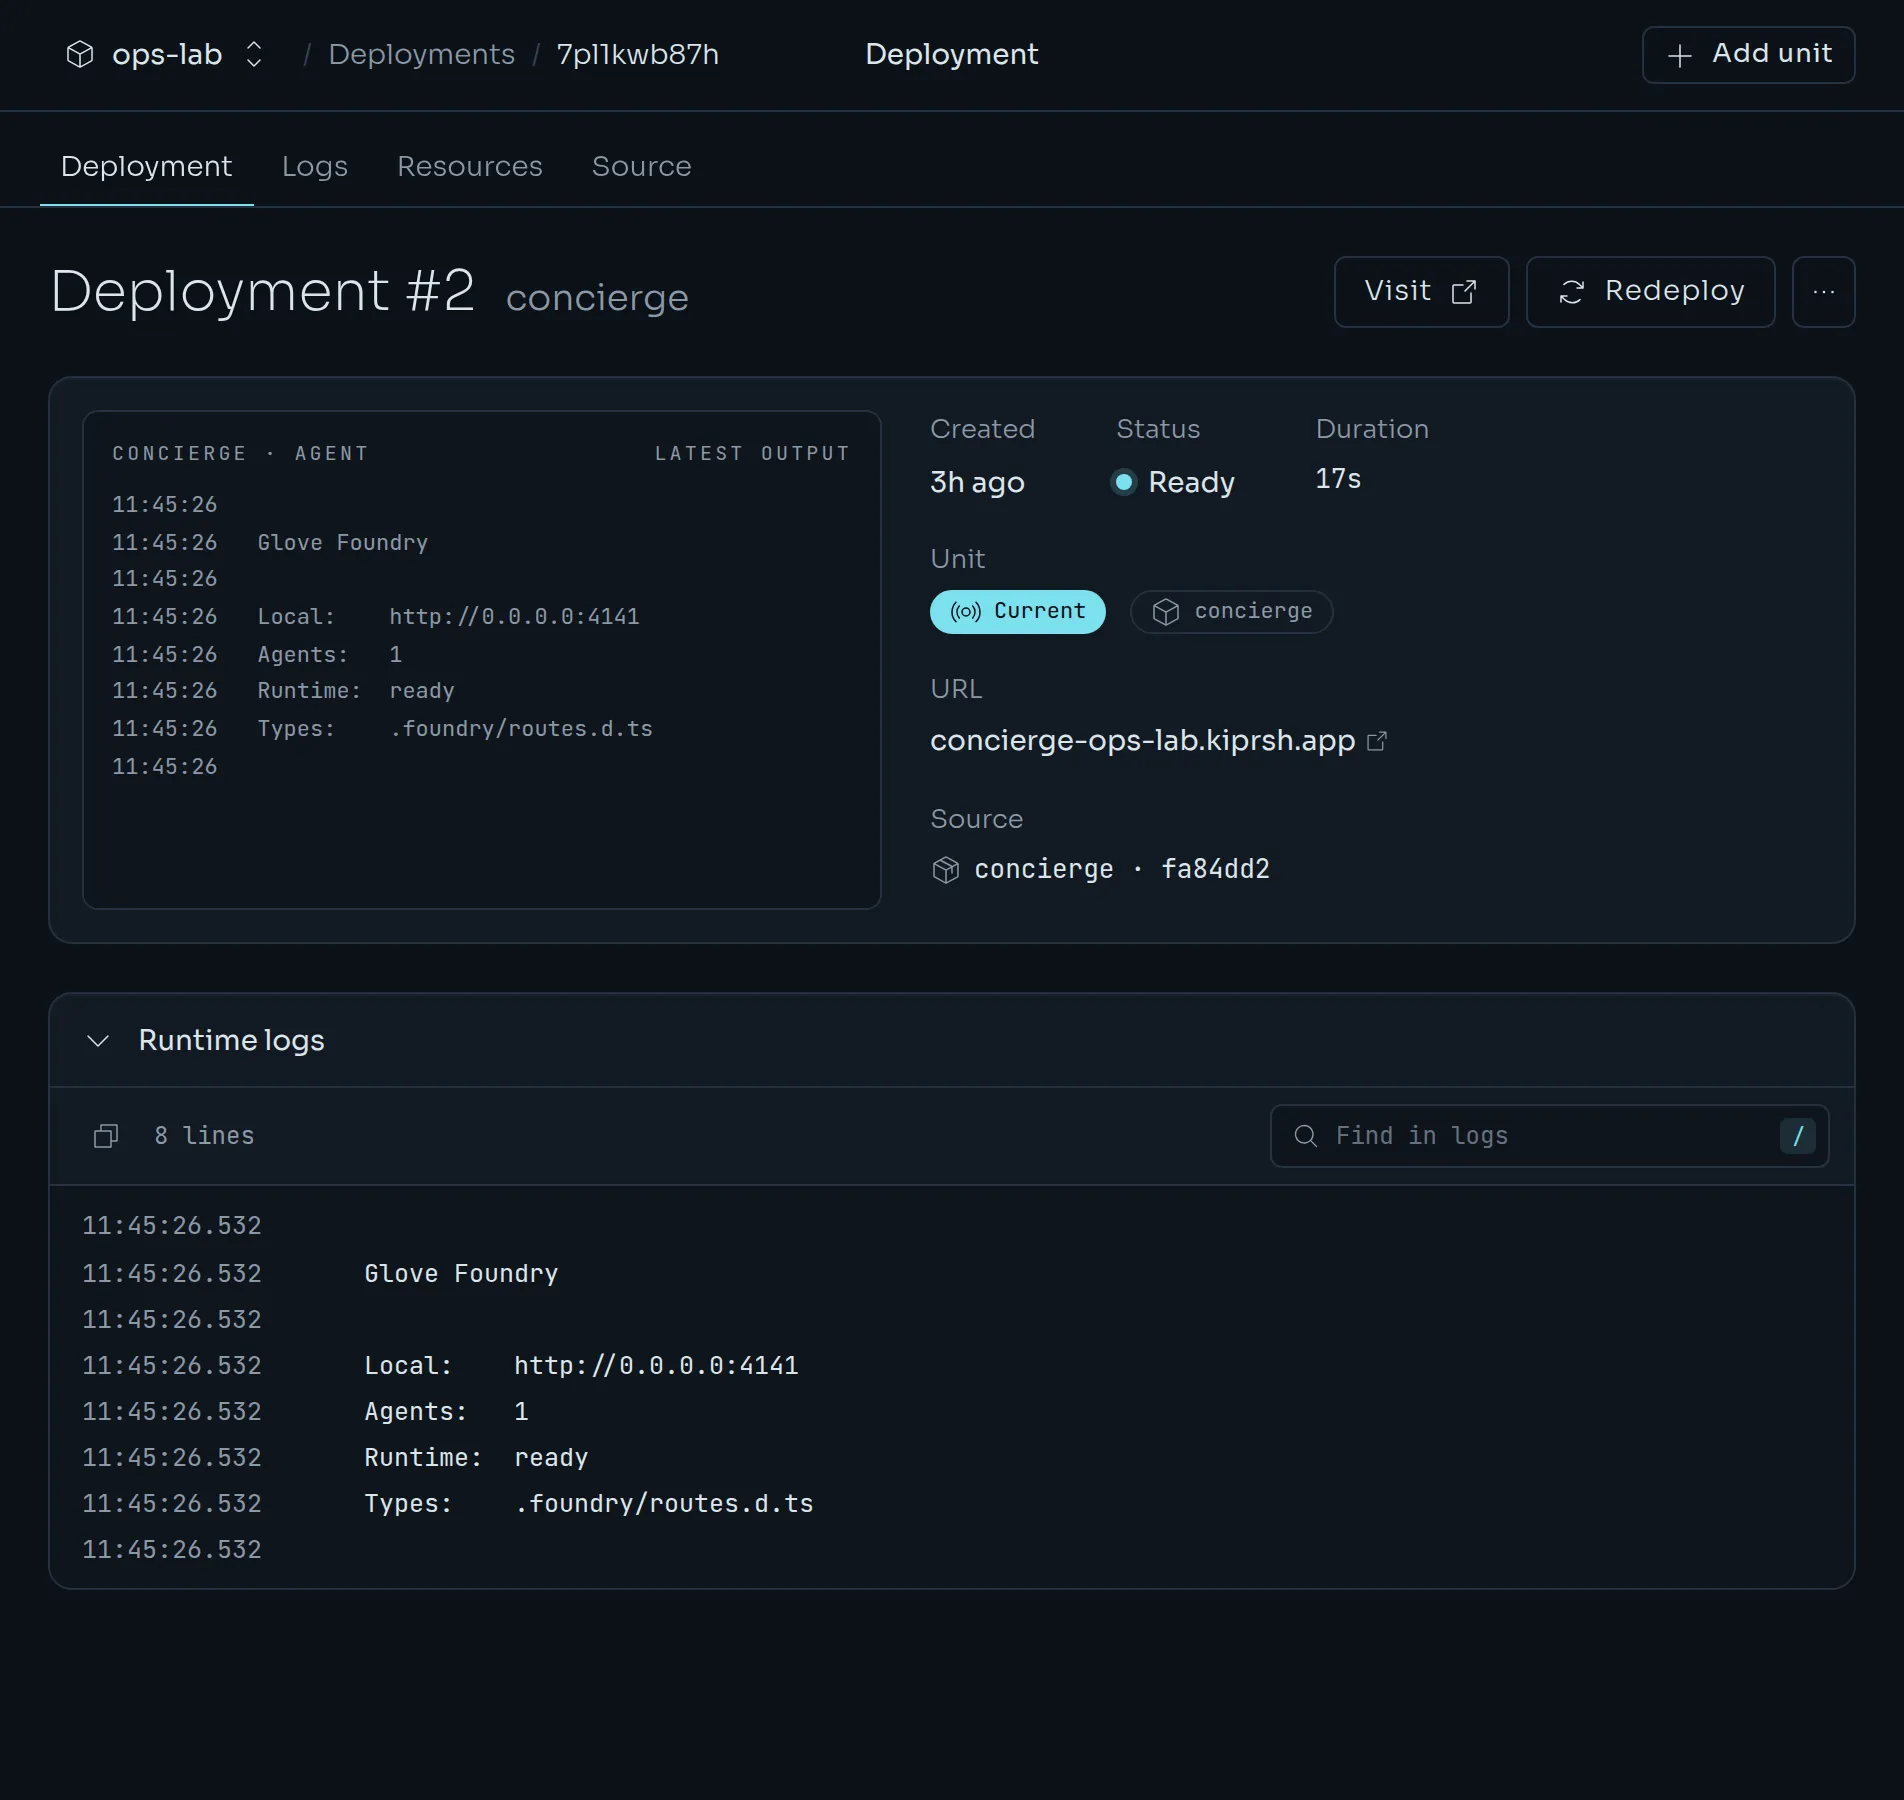
Open a deployment for its details: when it was created, its status, how long it took, its source and its logs. The tabs are Deployment, Logs, Resources and Source. Redeploy runs it again with the current variables, and Roll back to this makes an earlier deployment the live one.
Logs#
Pick a unit, choose all output, stdout only or stderr only, and how many lines to load: 200, 500, 1000 or 5000. The viewer follows the output live. Pause freezes it so you can read. Press / to search inside the logs.
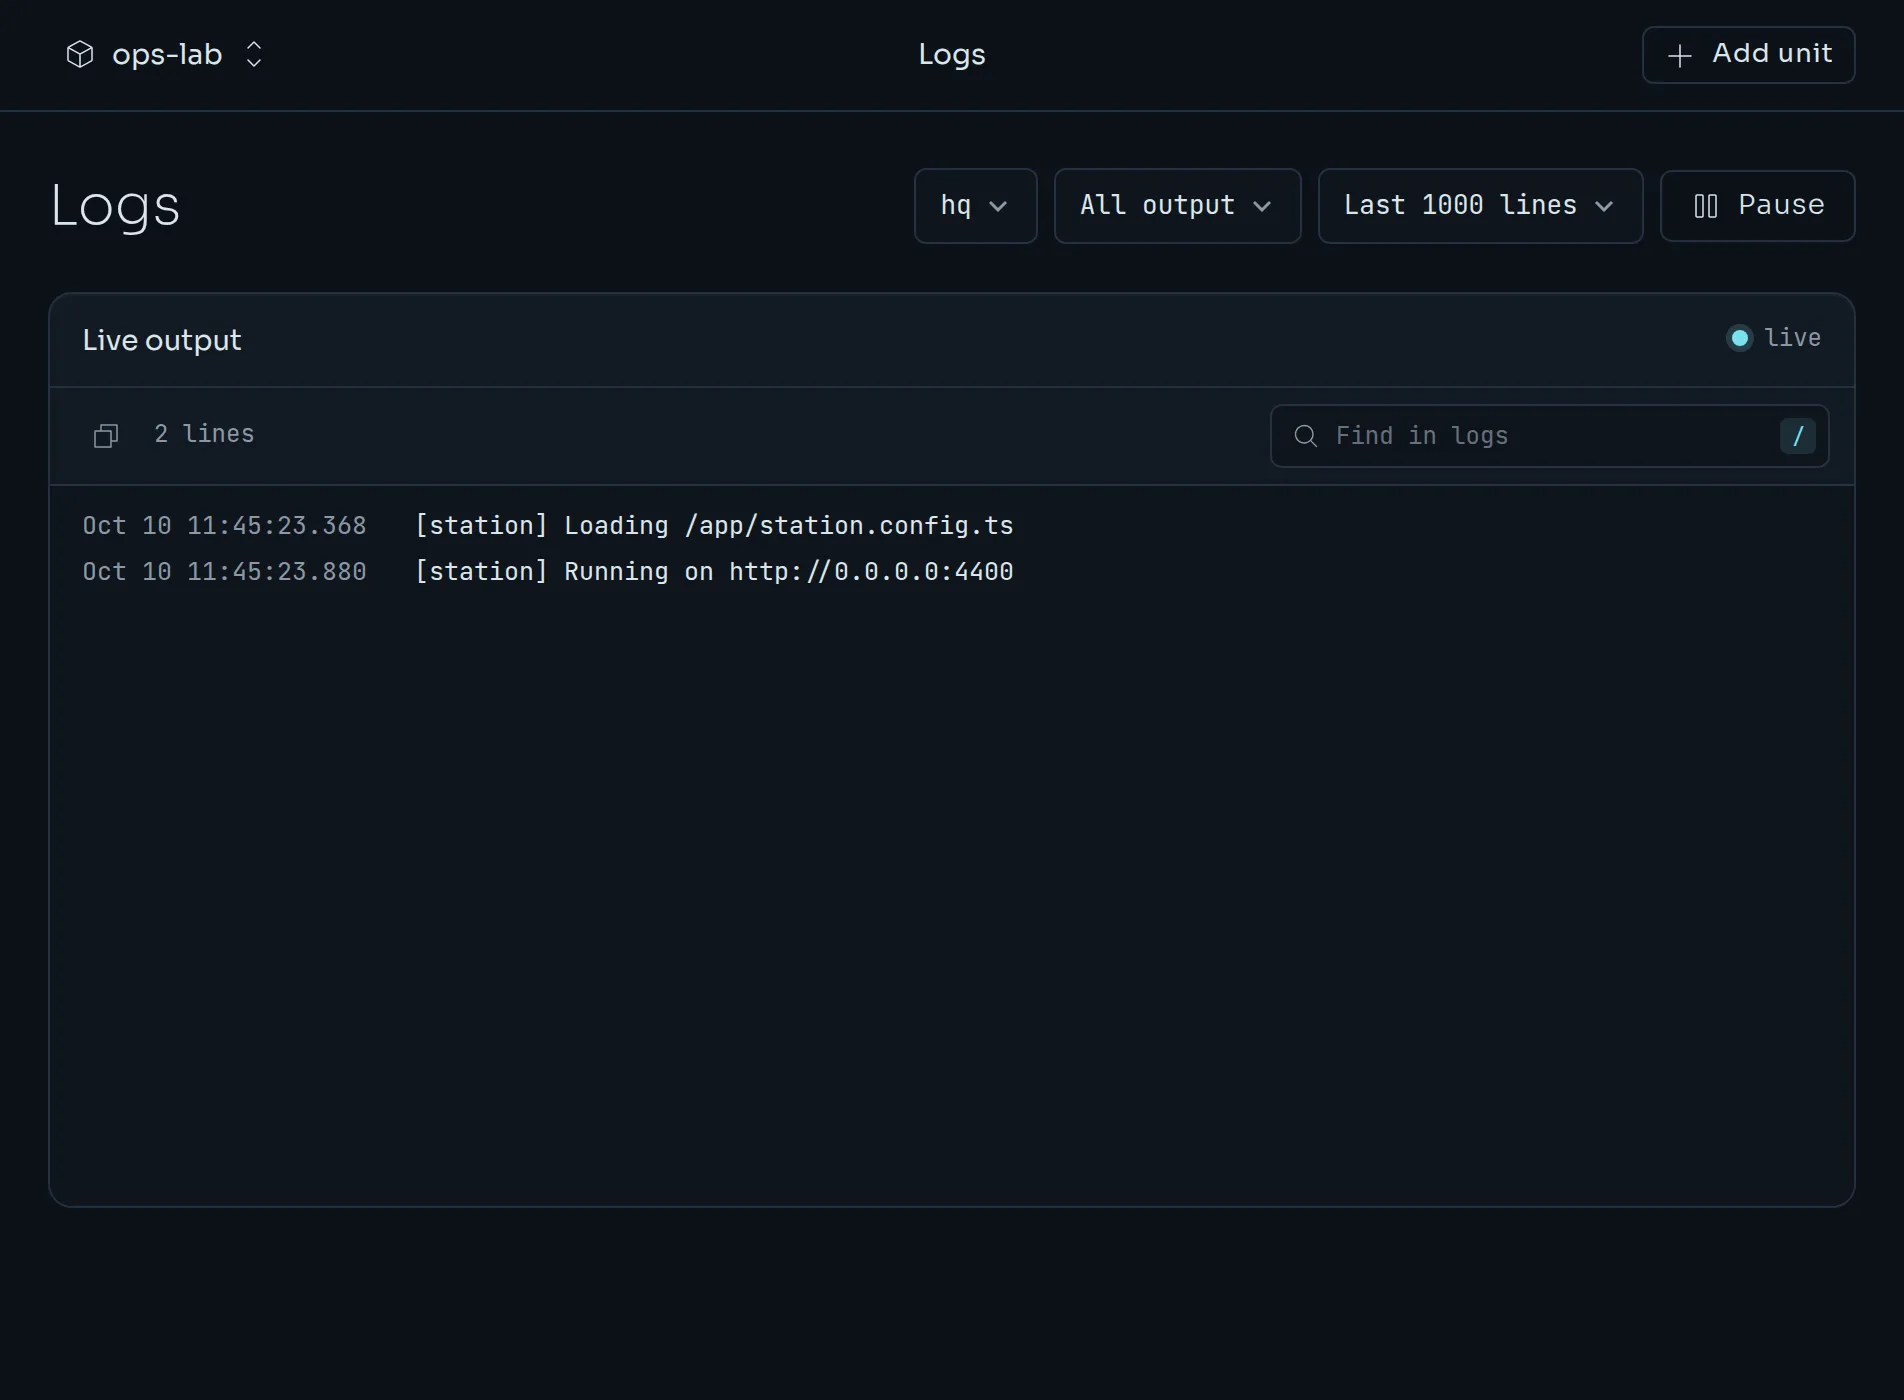
Kuiper keeps each unit's logs across crashes and redeploys, and redacts secret values as lines are written. See Logs, deployments and rollbacks.
Activity#
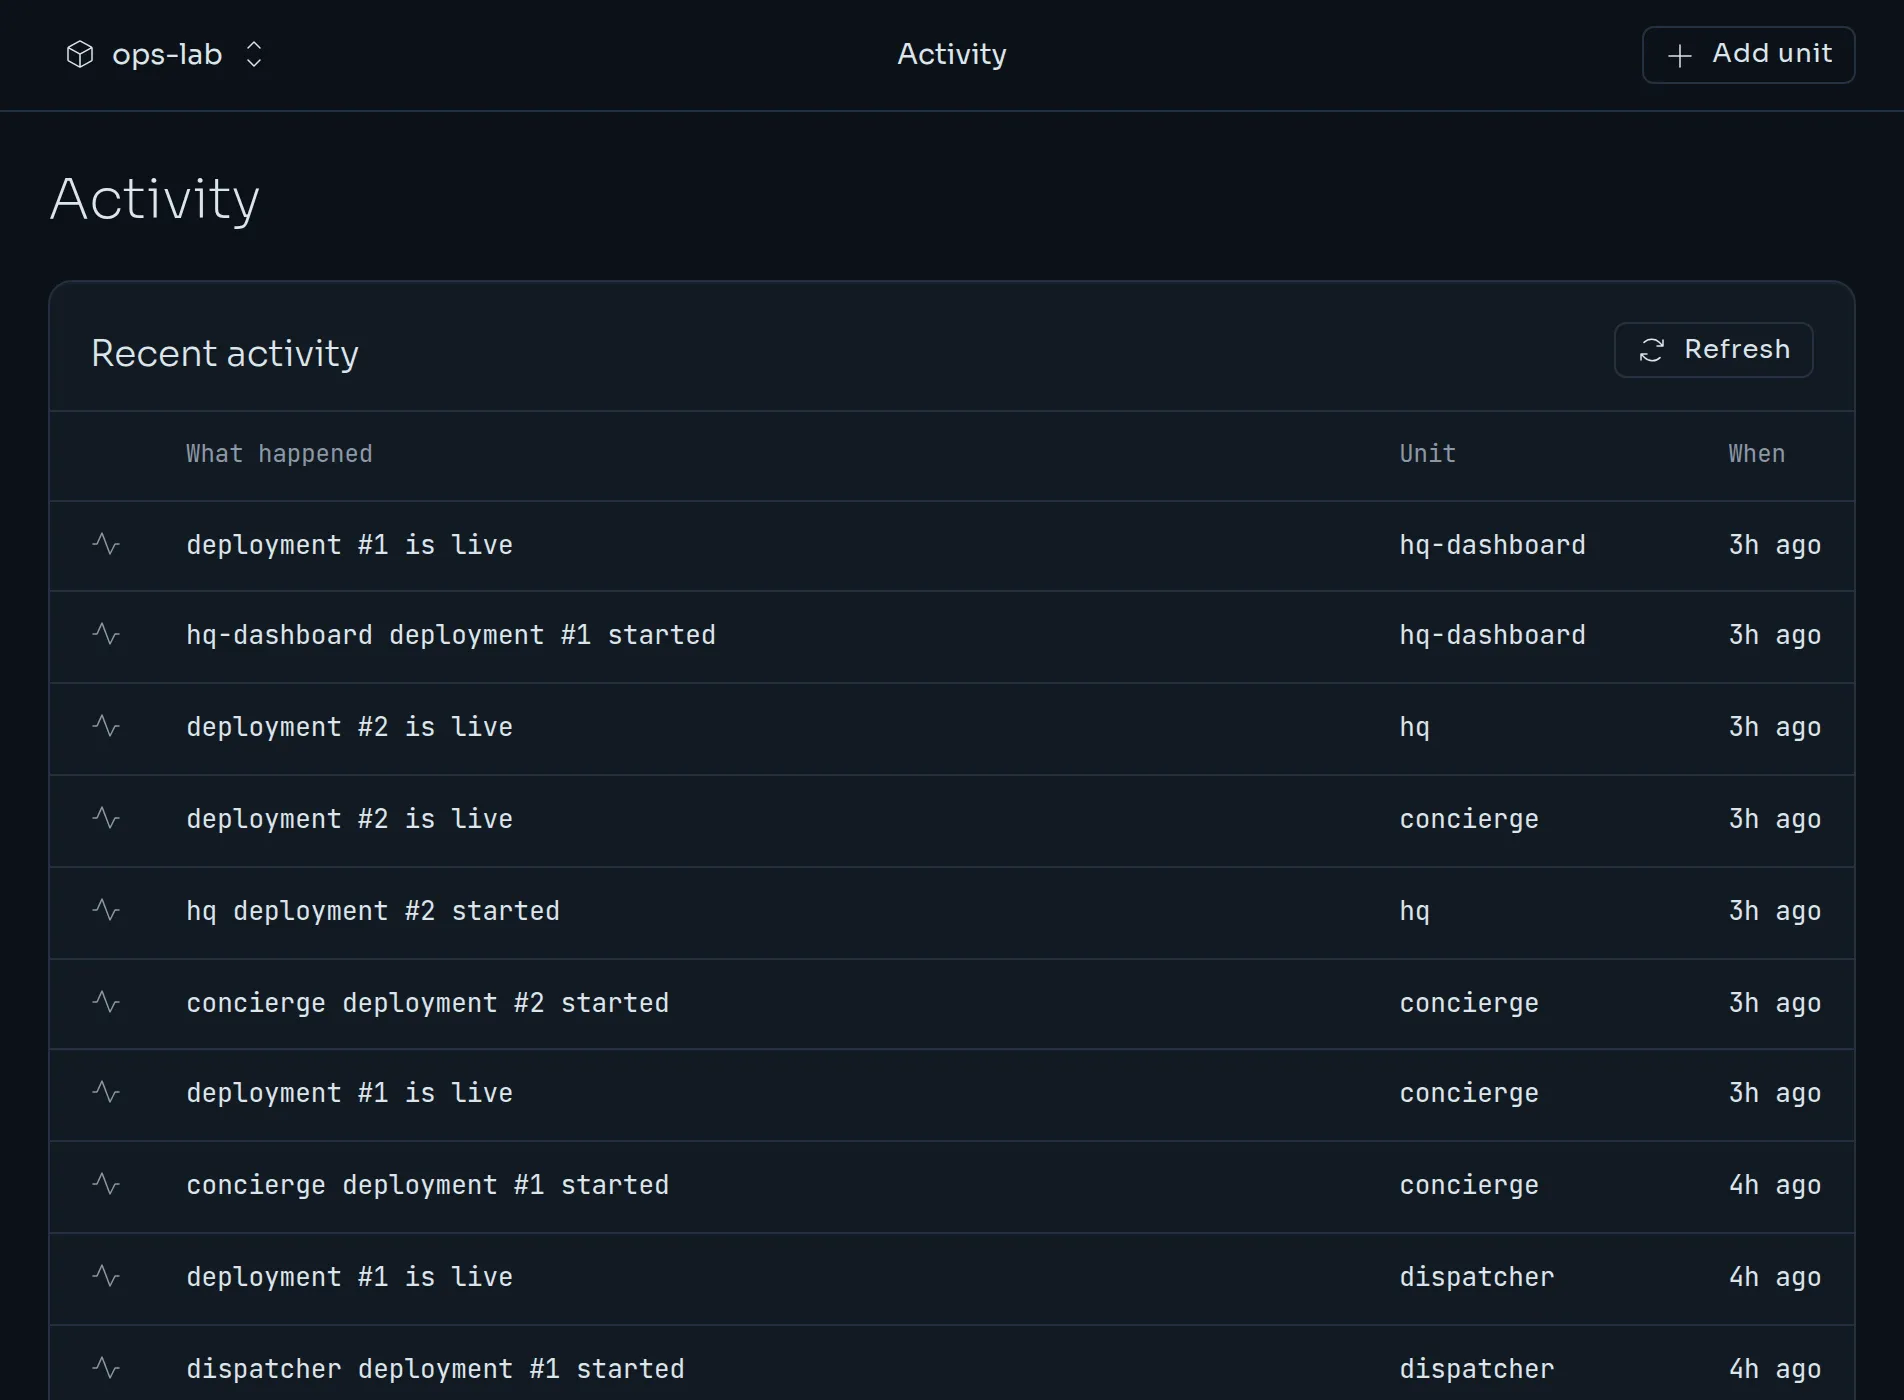
Activity is a feed of what happened in the project, newest first: deployments starting and going live, Station API keys created, domains moved.
Usage#
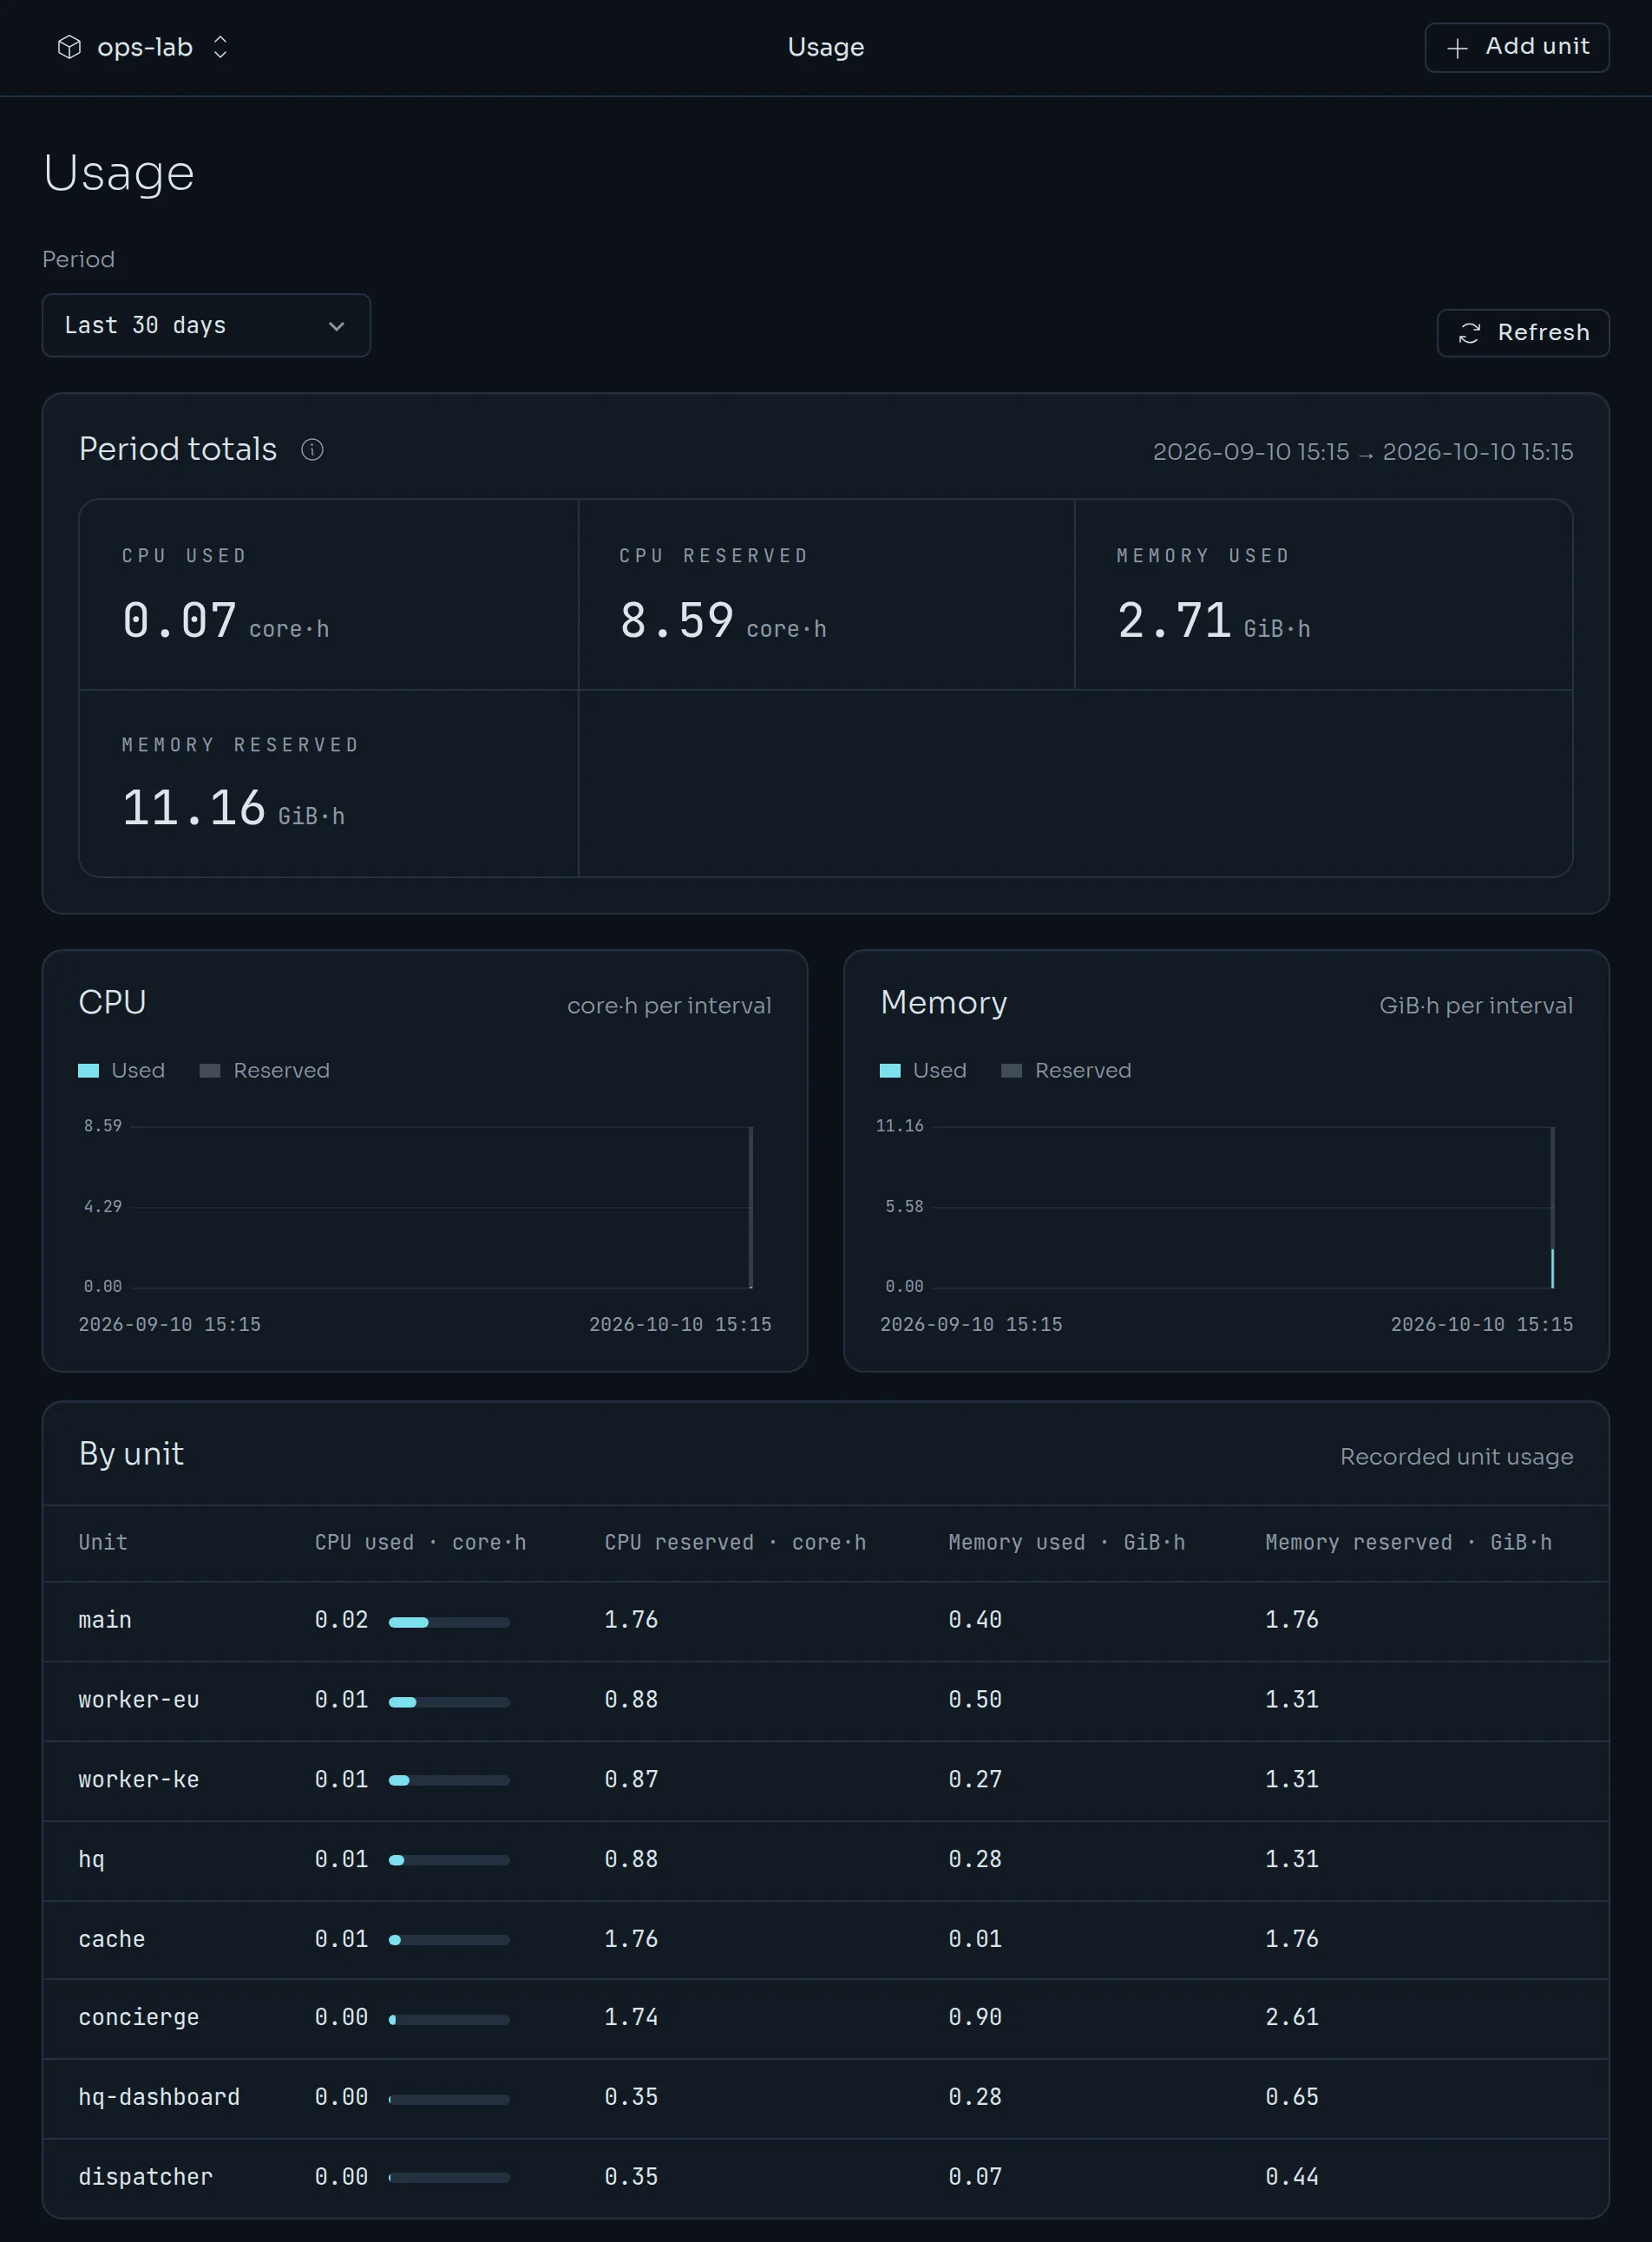
Usage shows how much CPU and memory your units reserved and how much they used. Choose a period of 24 hours, 7 days or 30 days. You get totals, a chart per resource and a table by unit. Reserved resources are what drives placement and billing.
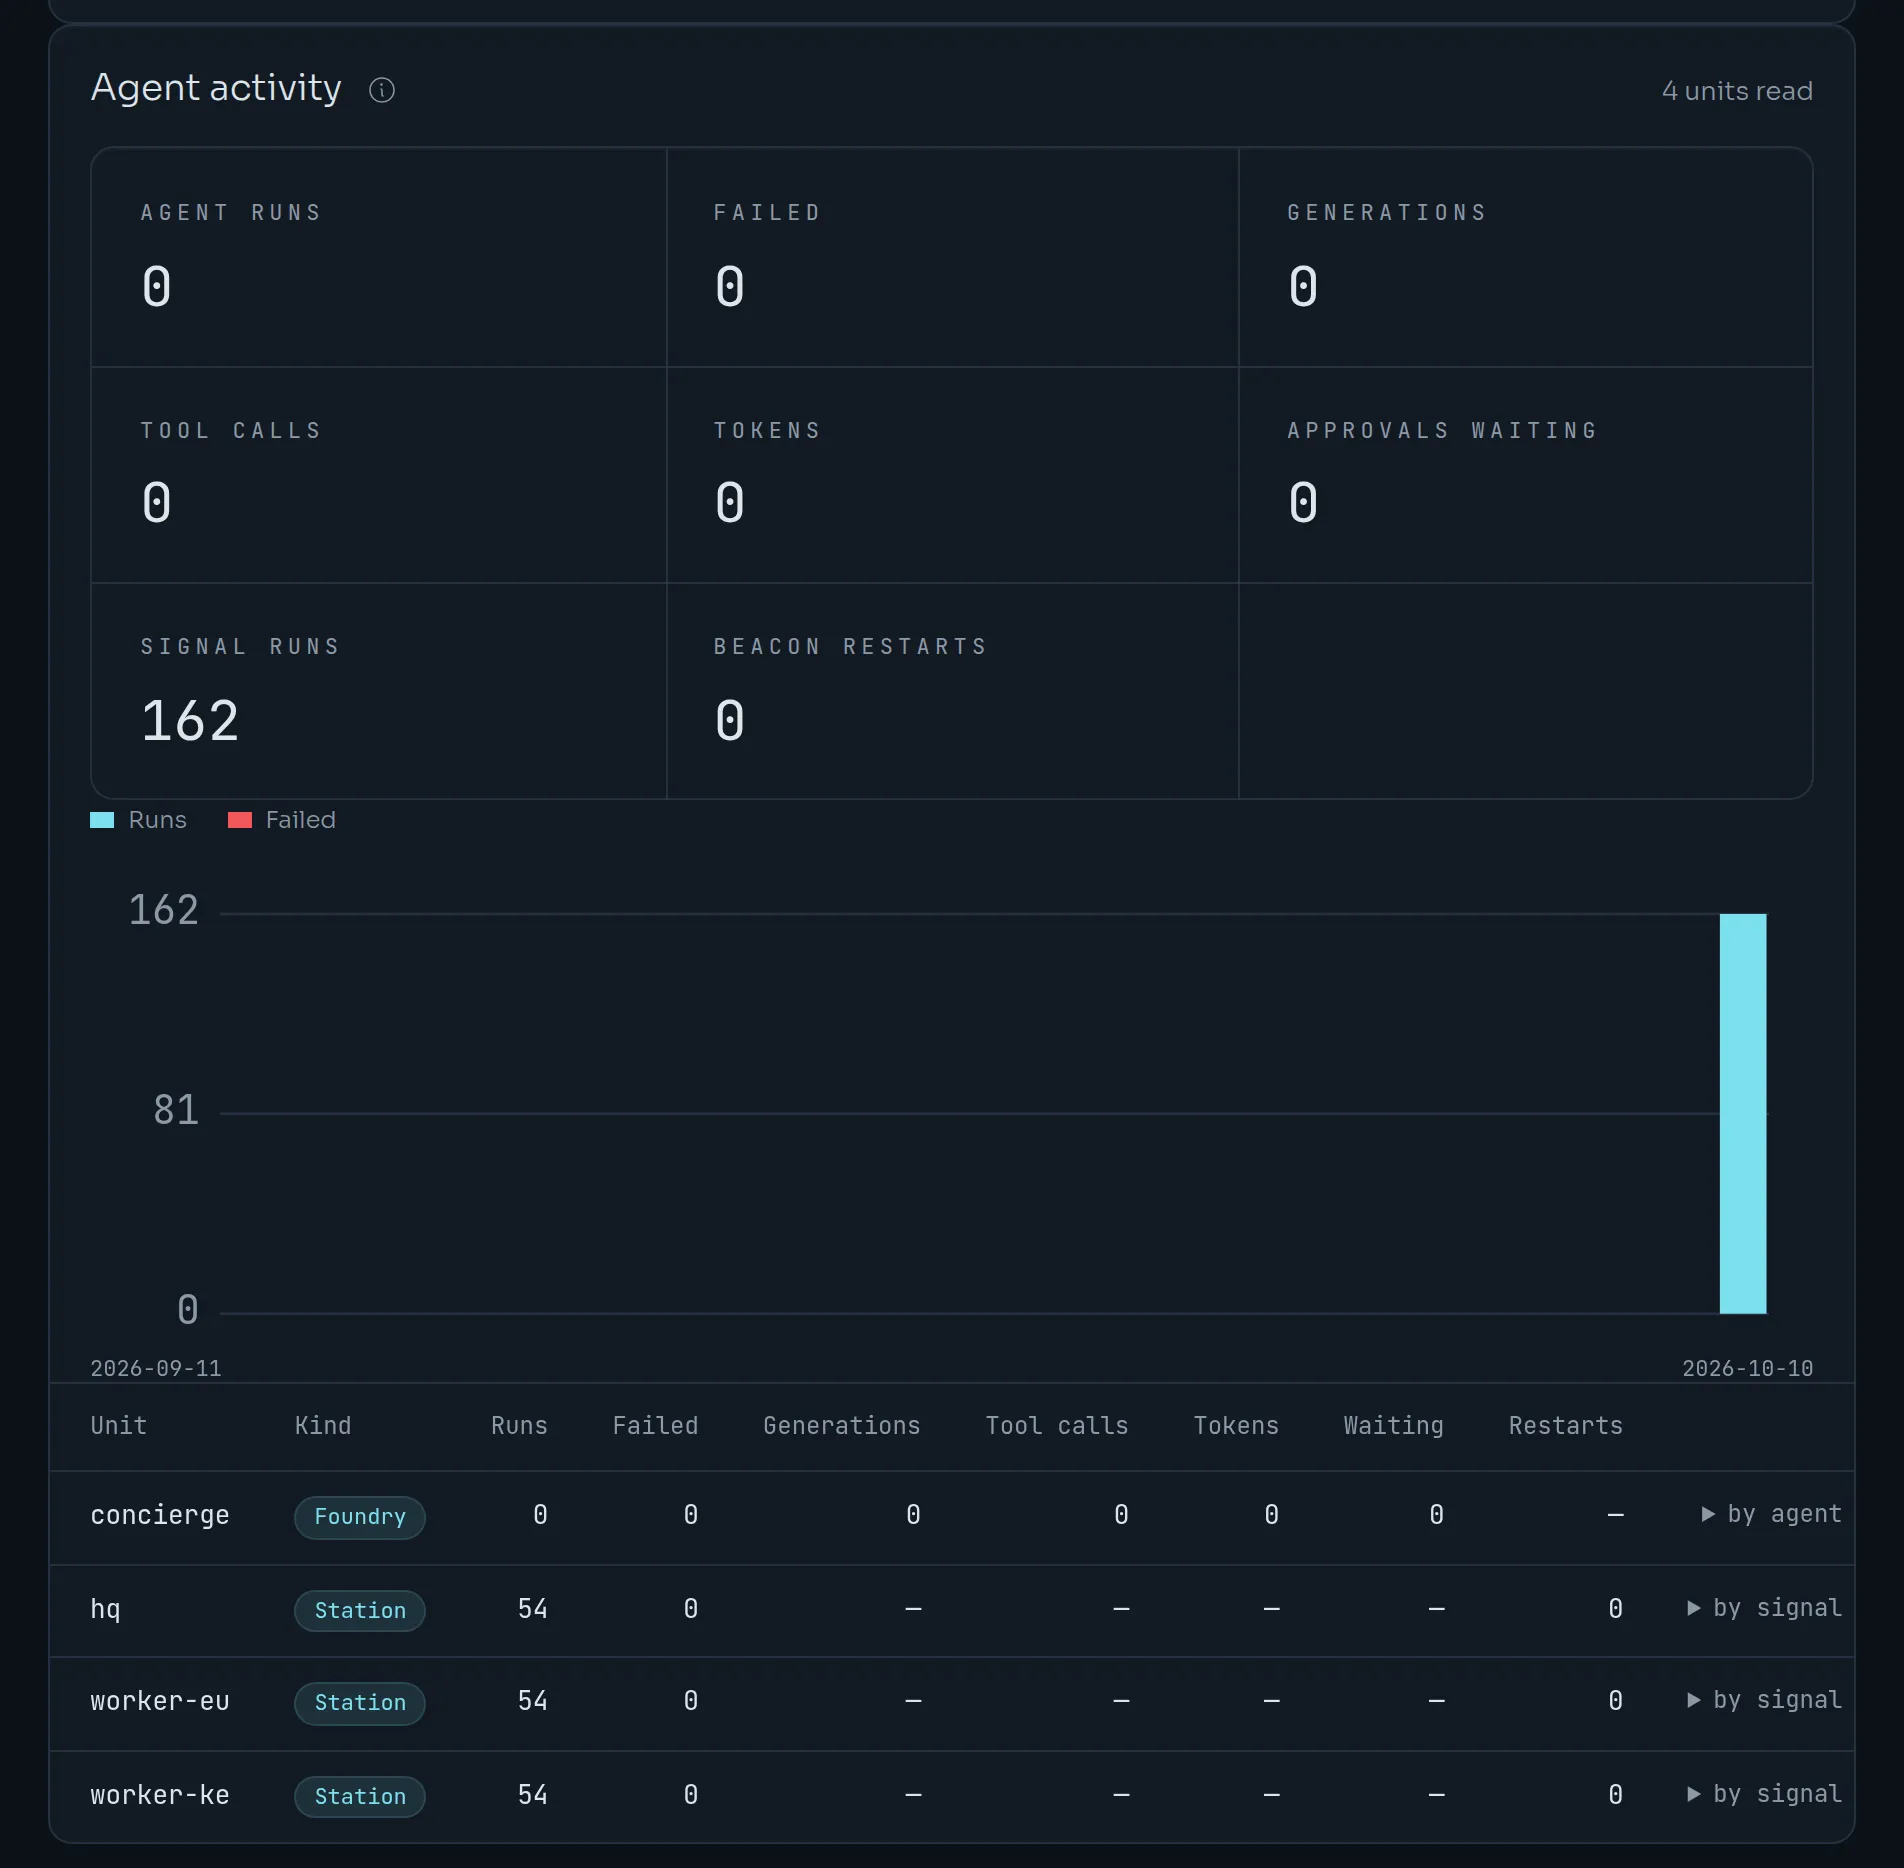
Below the table, Agent activity counts what your agents did in the same period. For Foundry units that is runs, generations, tool calls, tokens and approvals waiting. For Station units it is signal runs, broadcasts, beacons and beacon restarts.
Agents#
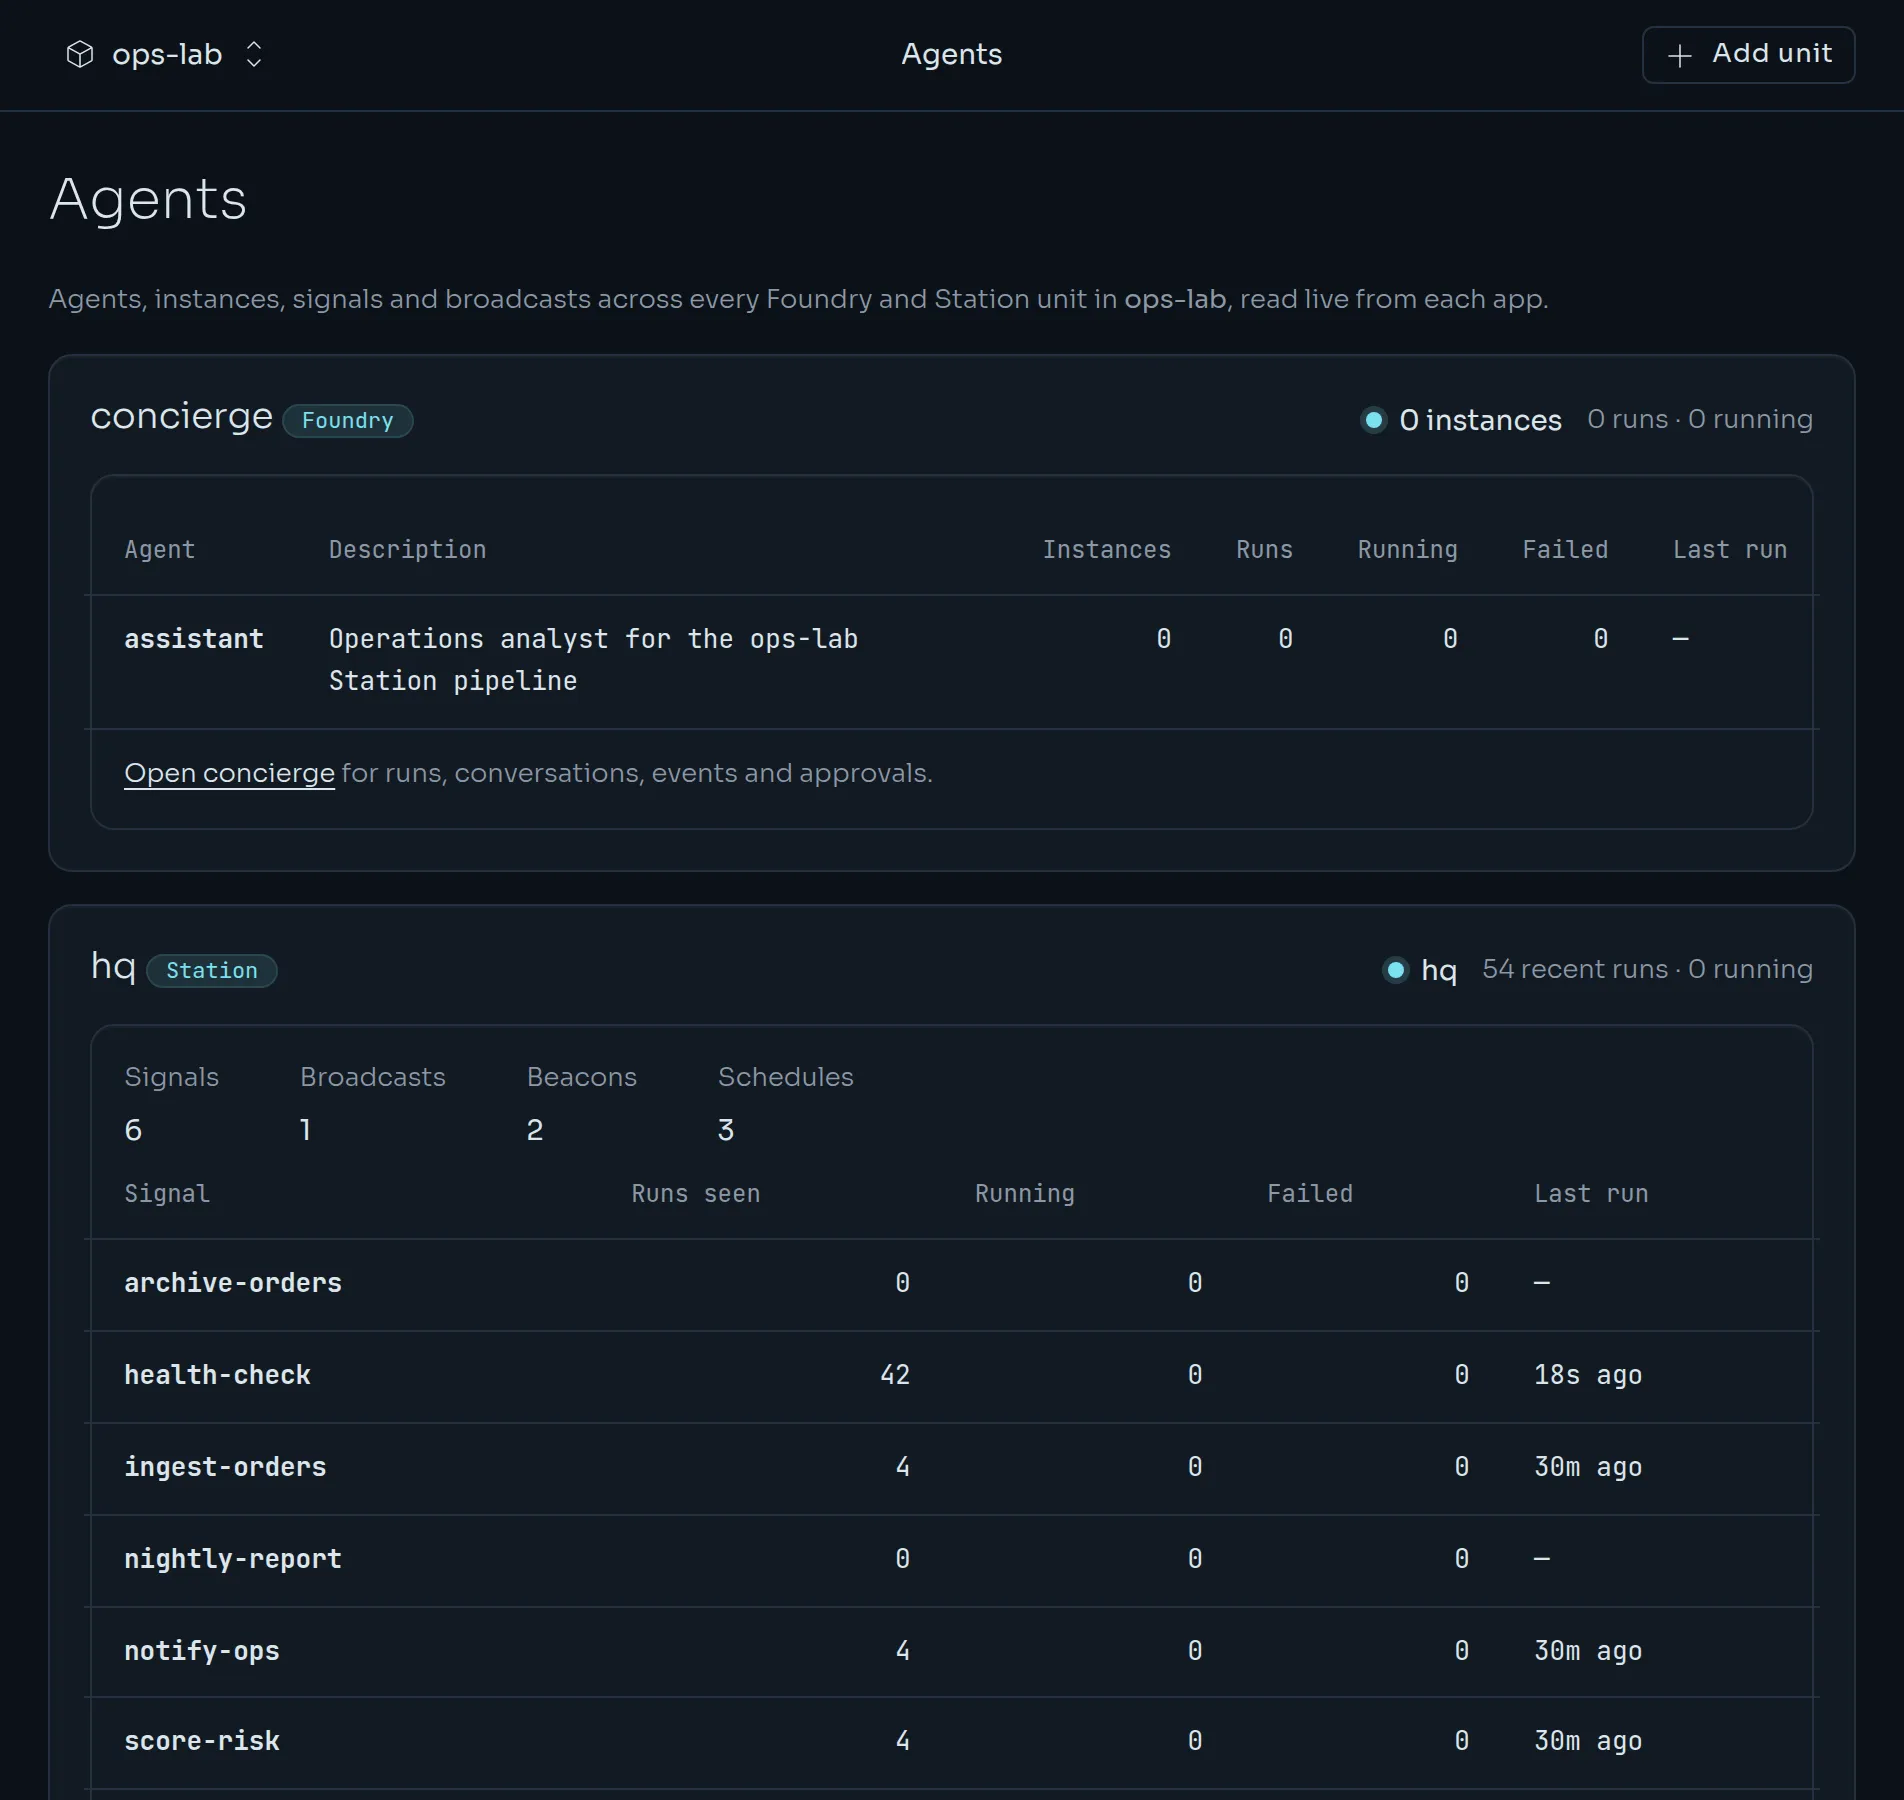
The Agents page shows every Foundry and Station unit in the project on one page. A Foundry unit lists its agents with instances, runs and failures. A Station unit lists its signals, with runs seen, running, failed and the time of the last run, and counts its broadcasts, beacons and schedules.
Variables, domains, databases, buckets and settings#
These pages manage what your units run with. Each has its own guide.
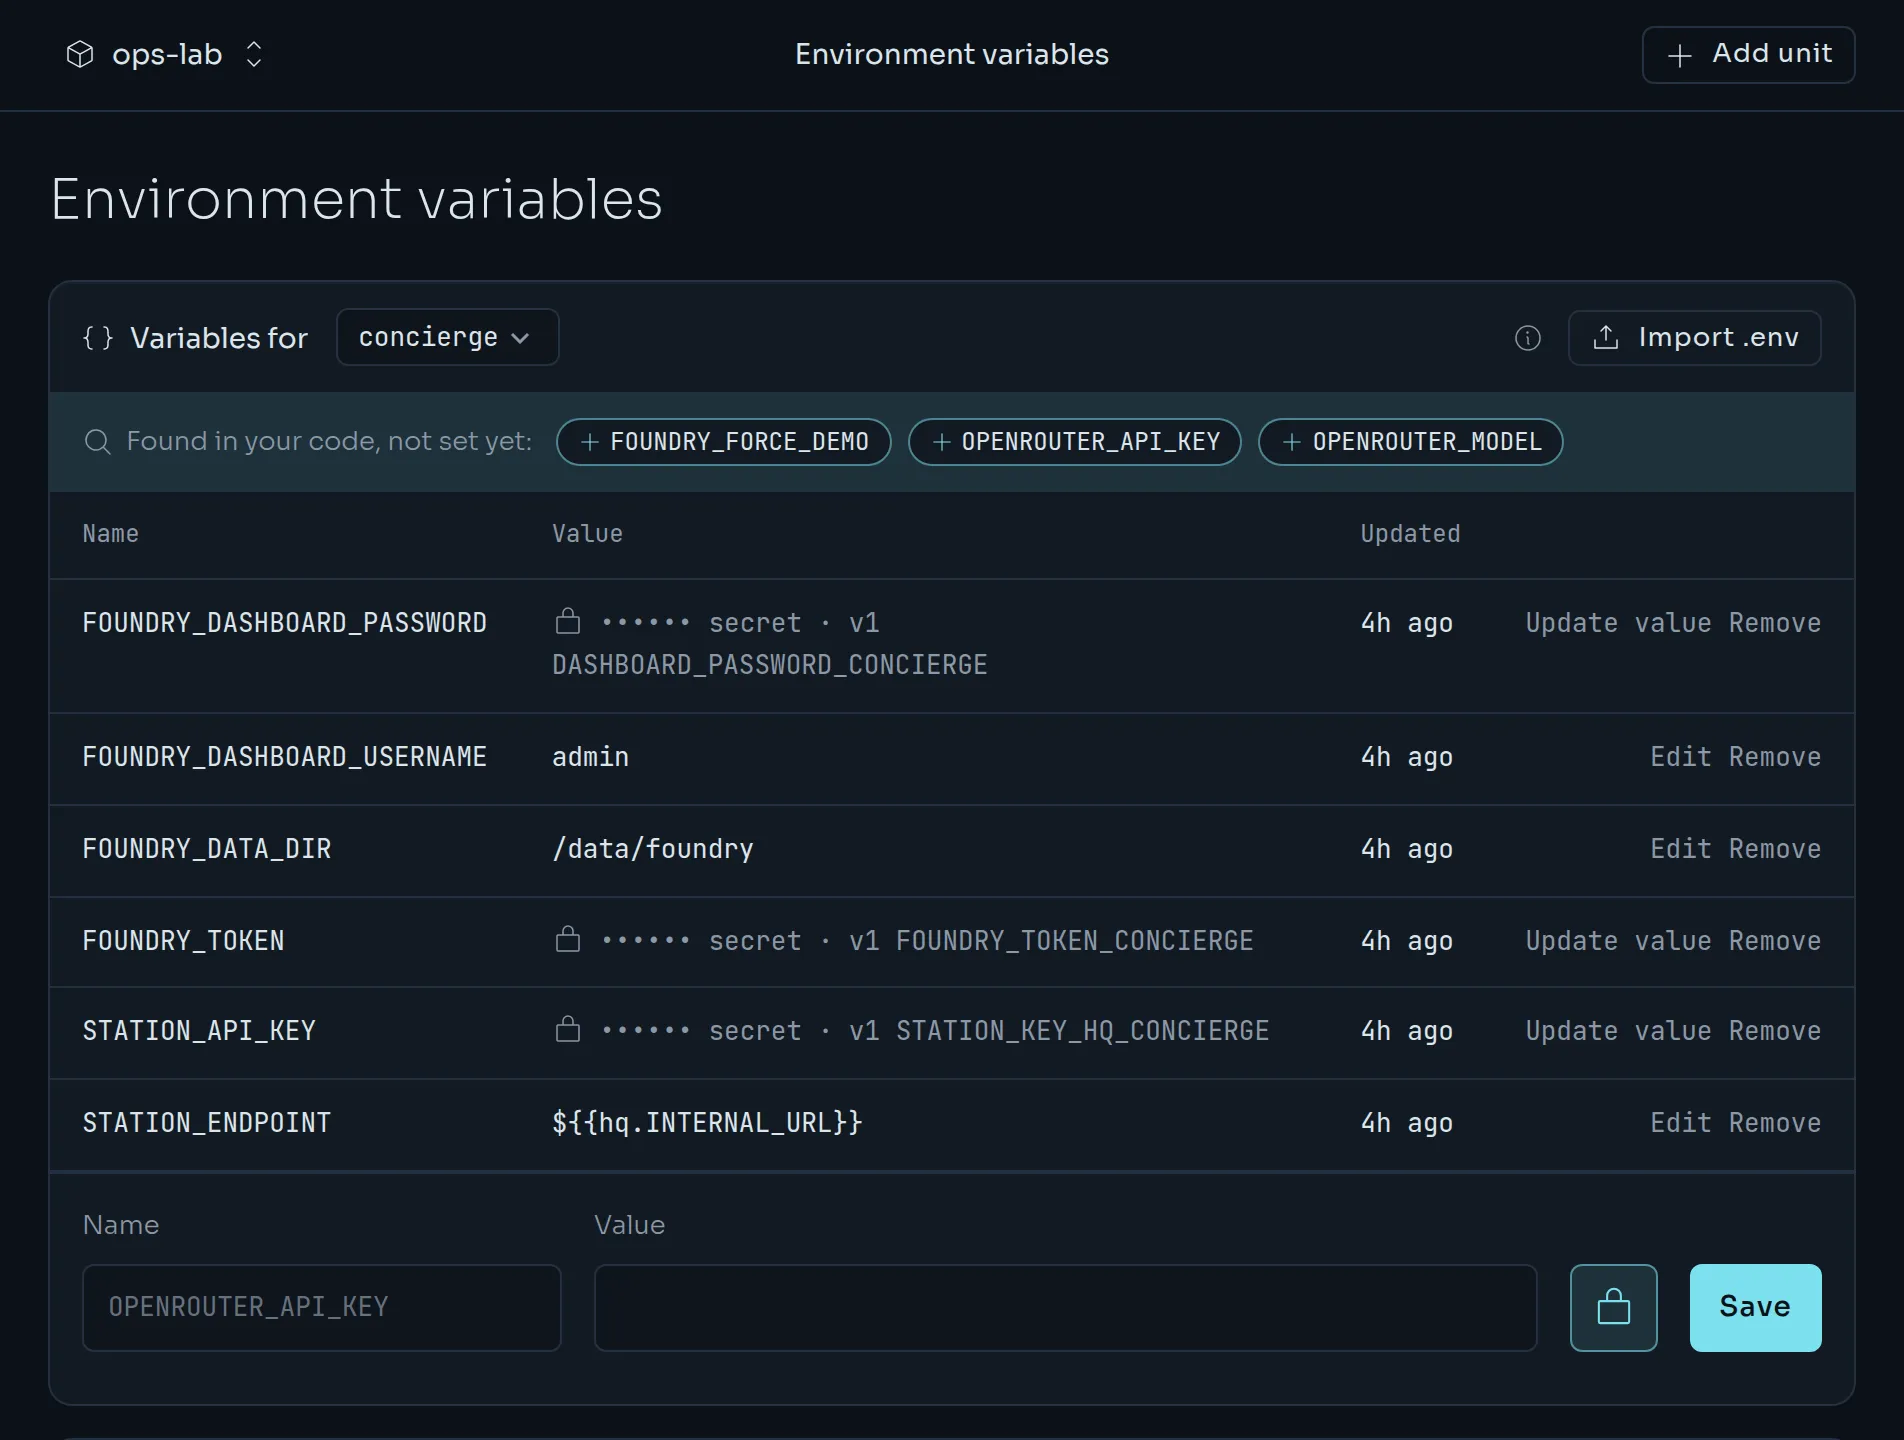
- Environment variables edits a unit's variables. Variables and secrets.
- Domains adds your own hostnames. Domains.
- Databases and Buckets create managed Postgres, Redis and object storage. Databases, Redis and buckets.
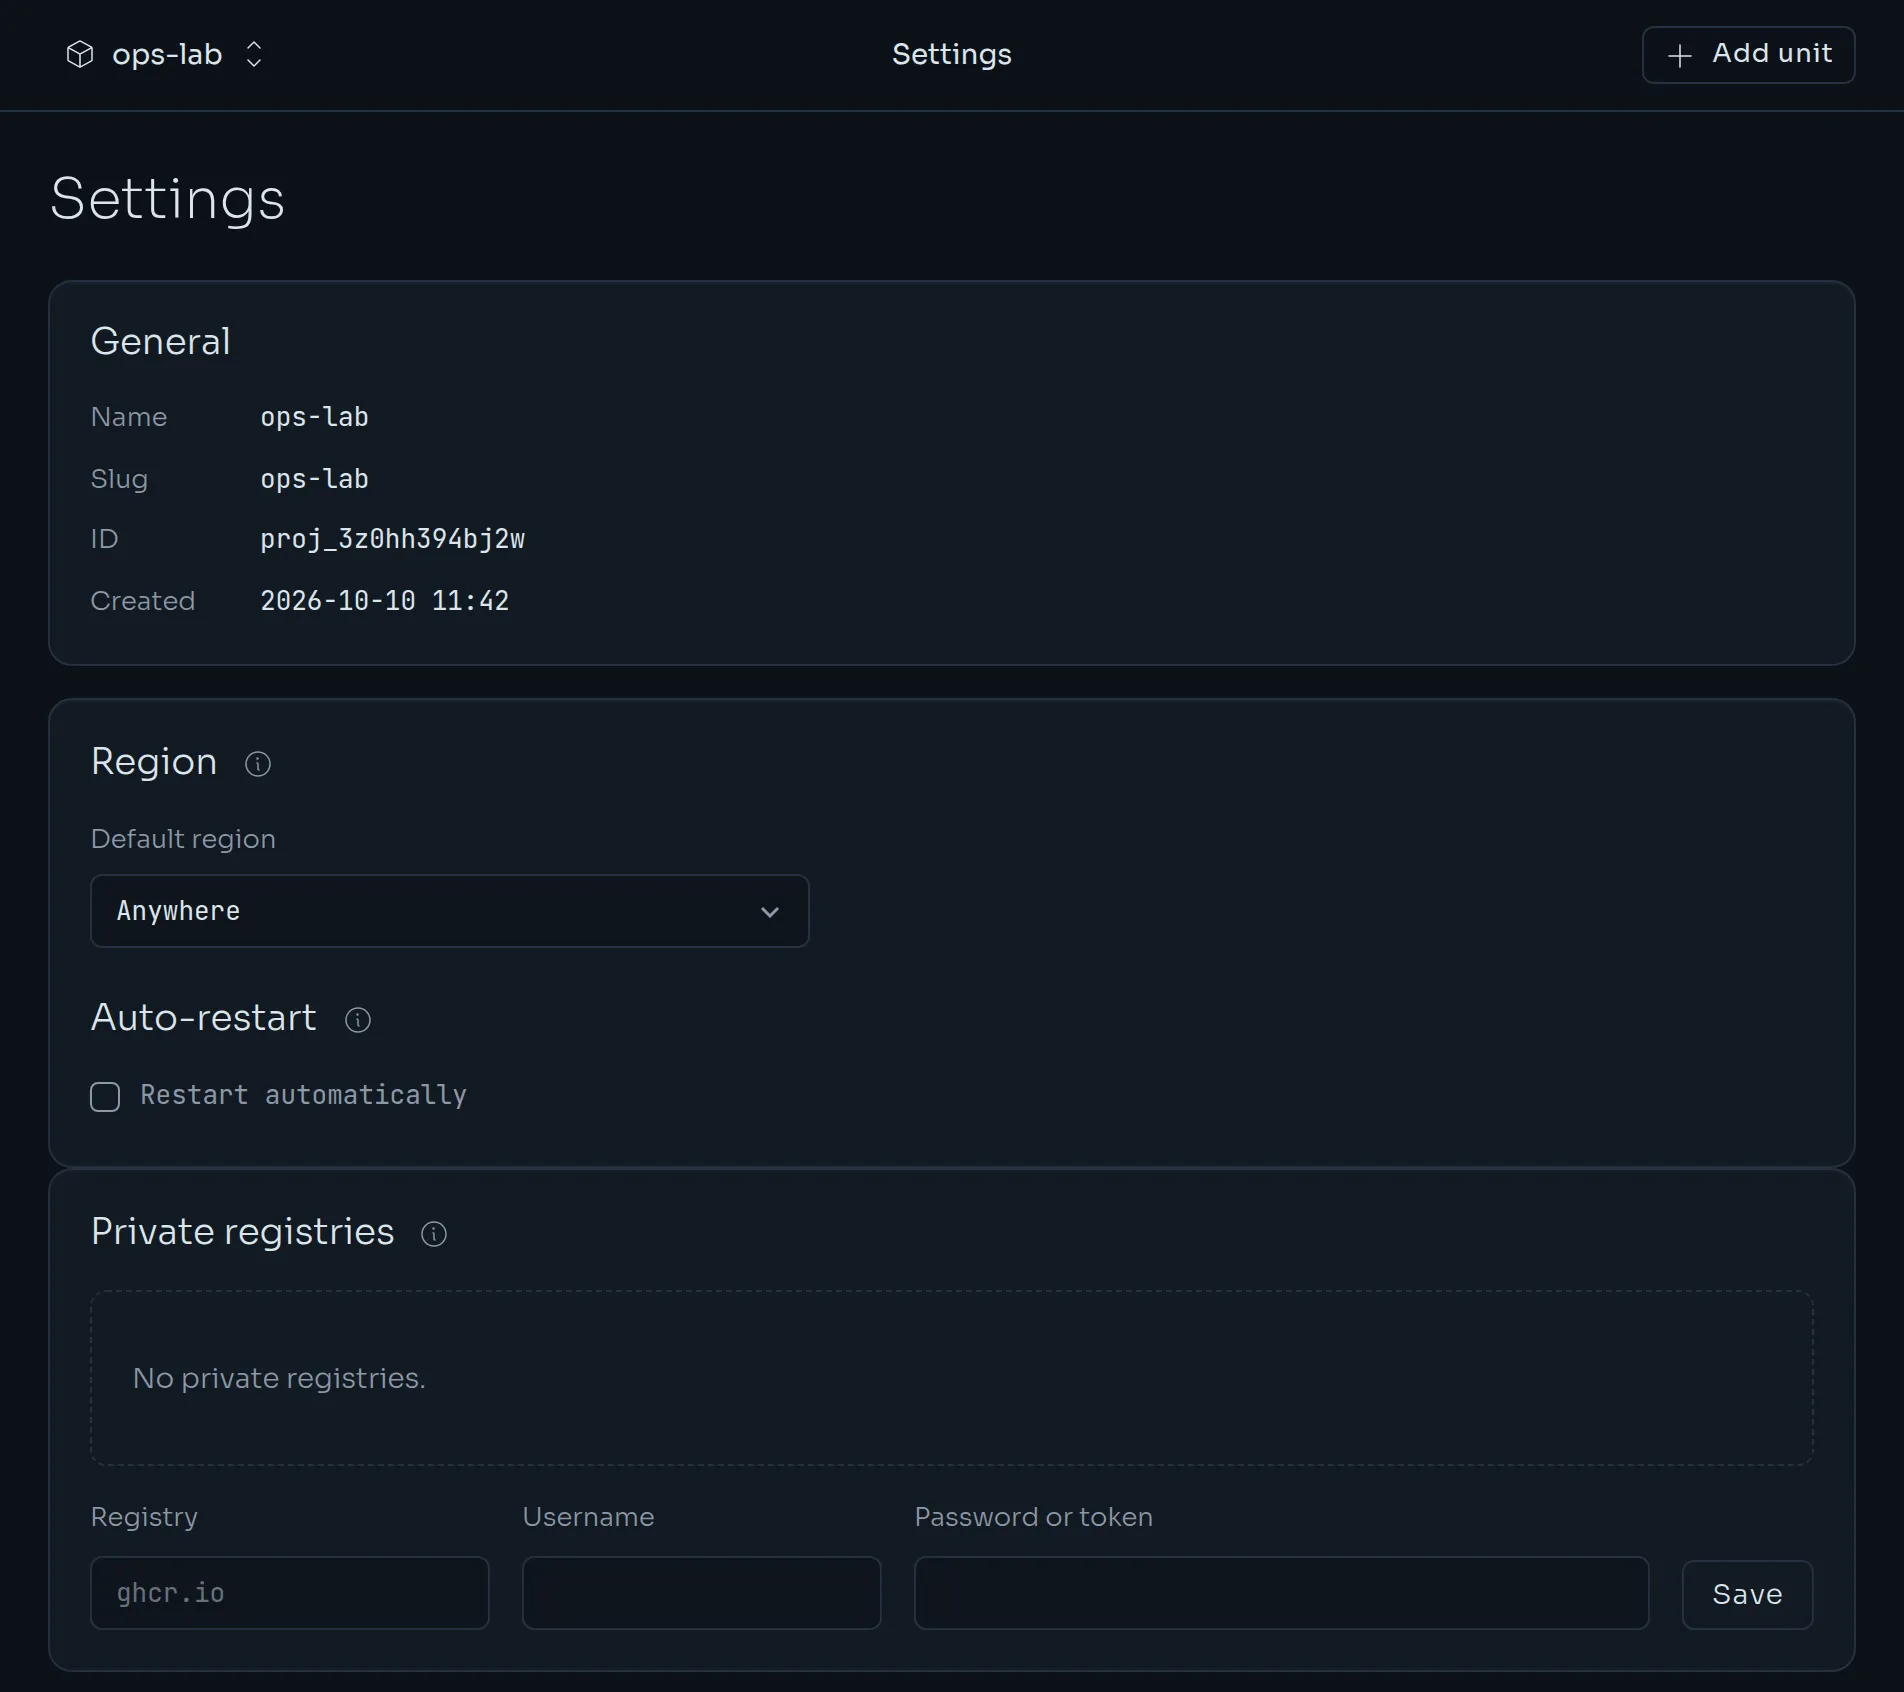
- Settings sets the project's default region, turns on auto-restart and stores private registry credentials. It is also where you delete the project.
Team, Git and API tokens#
Three organisation pages sit at the bottom of the sidebar. Teams, roles and tokens covers each in detail.
- Team lists members, invites people and sets roles.
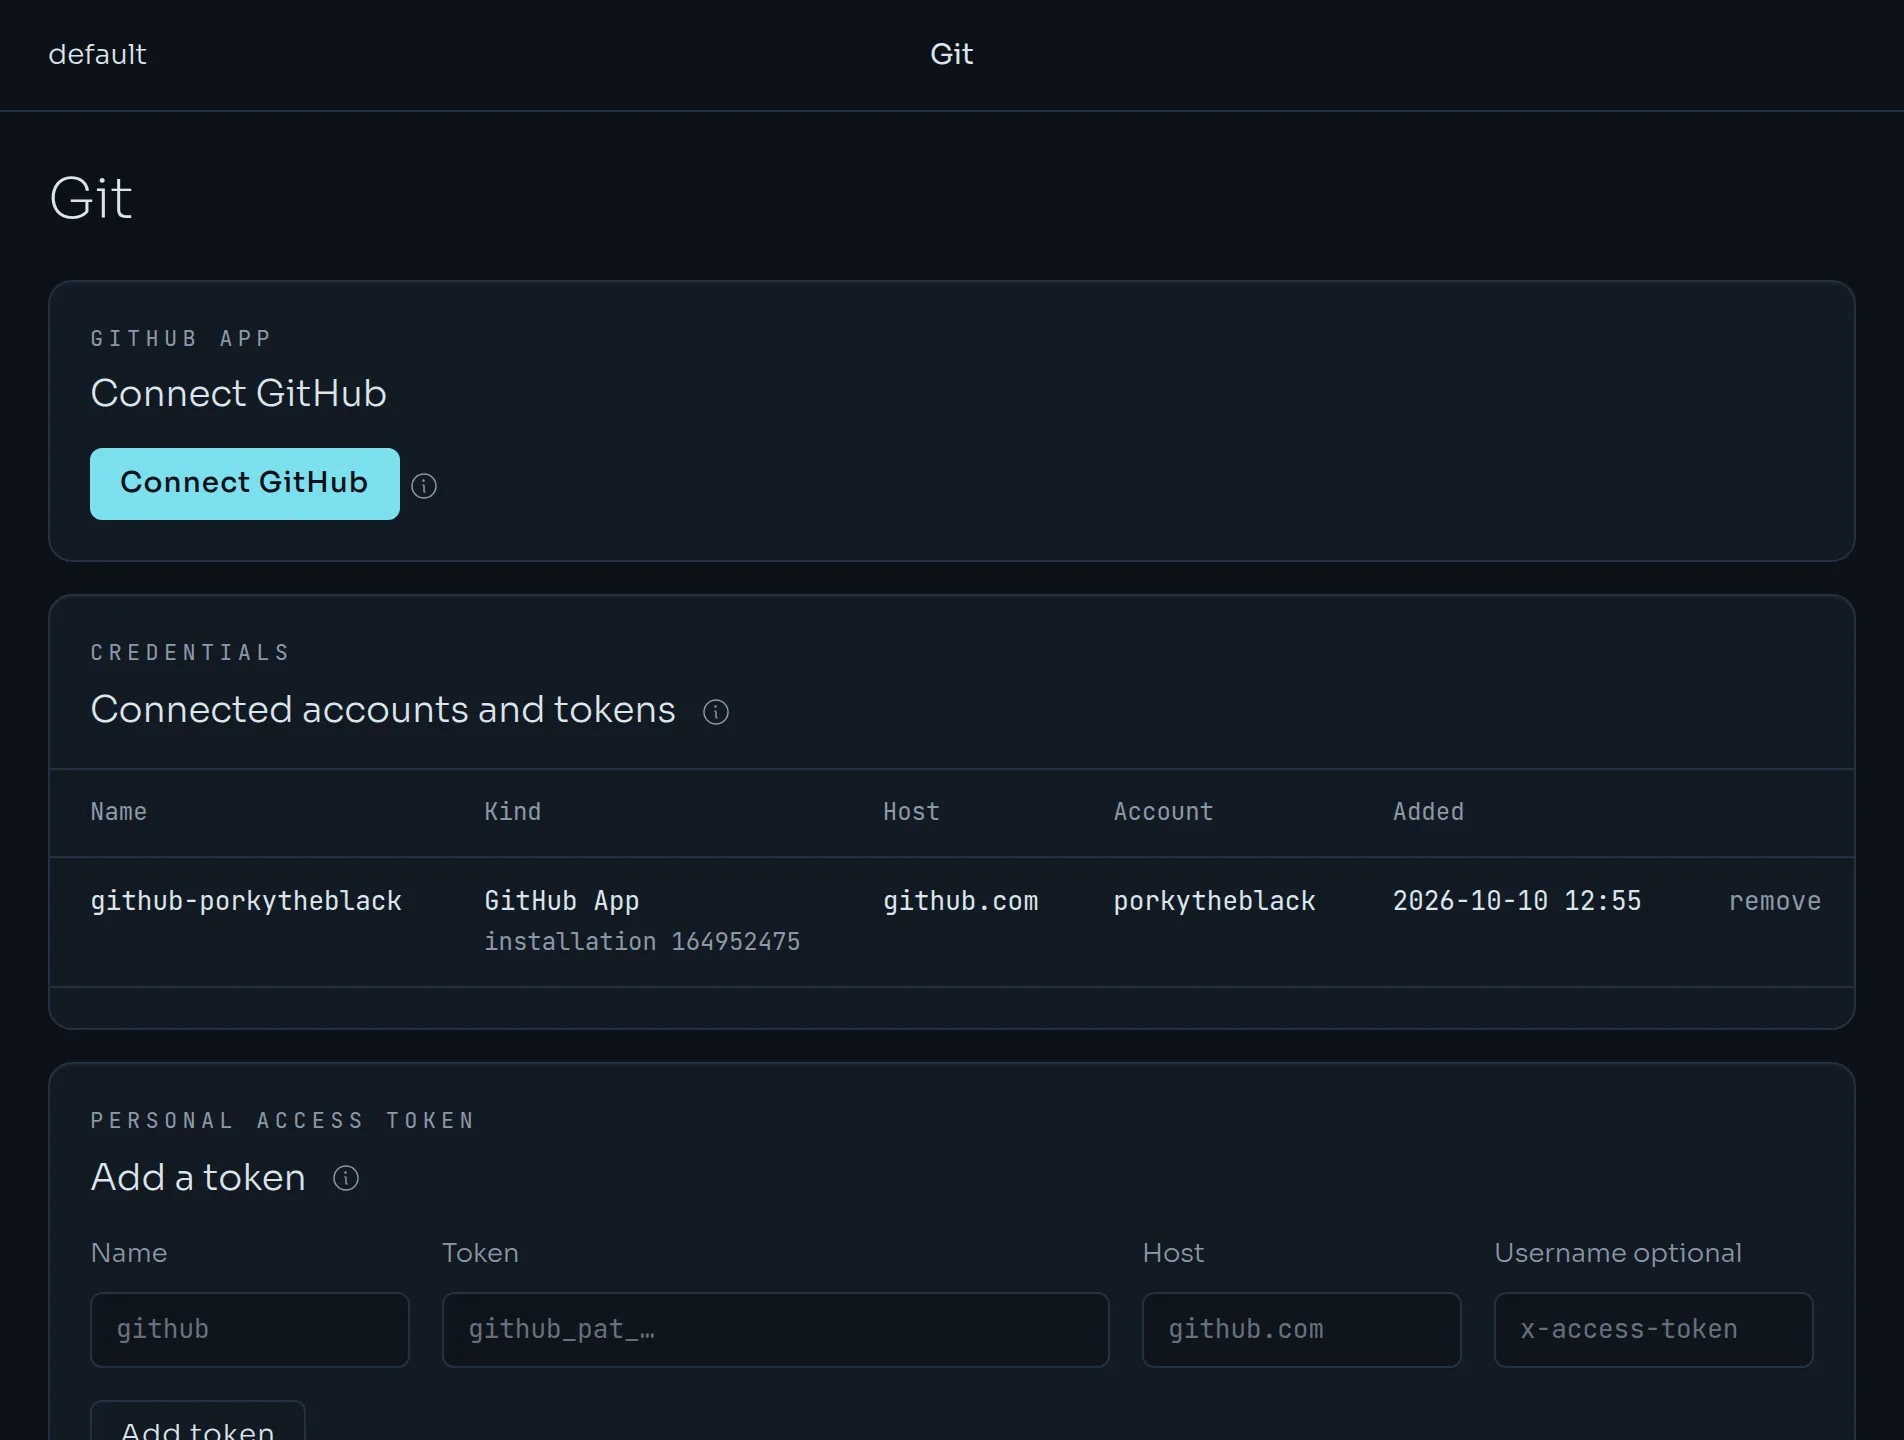
- Git connects GitHub and stores access tokens for other Git hosts.
- API tokens creates and revokes the tokens that the CLI and CI use.
Colour theme#
The Theme button in the sidebar cycles through system, light and dark. System follows your operating system.